Since the onset of the Covid-19 pandemic in the United States, more than 40 million people have applied for unemployment benefits. In April, unemployment spiked to nearly 20 percent, almost double the rate observed at the peak of the Great Recession. To blunt the financial blow, Congress passed the CARES Act, a package that included, among many other things, around $500 billion in income transfers for the U.S. population.
With my colleagues at Columbia University’s Center on Poverty & Social Policy, I have worked to understand how the CARES Act might affect annual poverty rates in the U.S. Our findings took us by surprise: despite the rapid rise in unemployment, we find that the CARES Act’s two major income transfers—the Recovery Rebates (one-time stimulus payment) and expanded unemployment benefits—have potential to return projected poverty rates to pre-crisis levels if access to the benefits is adequate. Jason DeParle of The New York Times neatly brings life to the findings here, while our full report can be found at the Center’s website. The report also details the many important shortcomings of the CARES Act, such as its exclusion of undocumented immigrants, the difficulties that families are facing in accessing the benefits, and the upcoming expiration of the top-up to unemployment benefits.
While our findings suggest that the CARES Act is effective at reducing poverty, they also raise fundamental questions about how we define and measure poverty. Consider that other recent studies have convincingly found rising levels of food insecurity, uncertainty, and hardship. If poverty rates remain relatively stable, we have to ask: is our definition of poverty consistent with the experience of families living below the poverty line? Are the conventional tools we use to assess the incidence of poverty fit for the present moment? These questions are not merely academic: comparisons of poverty rates across place and time are used to assess the efficacy of policy responses and the economic wellbeing of a nation’s population, as well as to guide future policy decisions. Given the stakes, it should concern us if the experience of poverty does not align with our measurement of poverty. Assessments of the CARES Act on poverty rates reveal one way in which our current approach to measurement might fall short.
To illustrate these concerns, I describe the income situation of a hypothetical family over a 12-month period, discuss whether our definition of poverty aligns with that family’s experience, and consider the policy implications of this distinction.
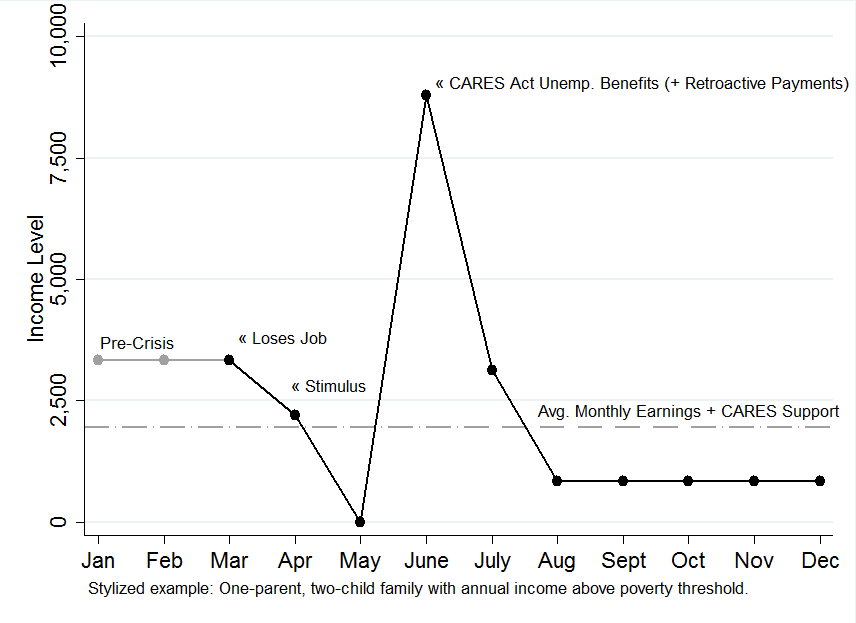
Figure 1: Stylized example of income volatility throughout year for single parent receiving CARES Act Recovery Rebate (“stimulus”) and unemployment benefits1
The figure above presents the stylized income situation of a single mother with two children. In this example, the mother loses her job in March, but cannot access her unemployment benefits until June. (This is the reality for many jobless adults applying for unemployment benefits, particularly in states like Florida, which have responded slowly to the crisis.) In April, the mother receives her stimulus check, but nothing more. In May, she receives nothing as she awaits her unemployment benefits. And finally, in June, she receives her unemployment benefits, as well as the retroactive unemployment payments she is due for the prior two months.
The real trouble begins in August, the month after the $600 per week unemployment bonus (Pandemic Unemployment Compensation, or PUC) is set to expire.2 From August through December, the single mother is left with a few hundred dollars per month in extended unemployment benefits. As a result, this family lives six months of the year with very little income.
Does this family live in poverty? If you asked the single mother in December, after half a year of minimal income support, she would likely say yes. But according to the Supplemental Poverty Measure (SPM), and most other annual poverty frameworks, the answer is no. The family’s annual income just surpasses the poverty threshold. Though nearly one-third of the family’s annual income comes in a single month, and though the family must scrape by for half a year without decent, regular income support, the CARES Act does just enough to lift the family above the line.
This is where our conventional approach to poverty measurement misleads us.
In past research on intra-year income volatility, scholars have demonstrated that it’s not just about how much a family makes over the course of the year, but whether that family can count on a consistent income from month to month. In The Financial Diaries, for example, Jonathan Morduch and Rachel Schneider vividly capture the challenges experienced by families who have annual incomes above the poverty line, but face large month-to-month swings in income. In the low months, such families resort to borrowing from friends and family, negotiating with creditors, or foregoing basic necessities to get by until their incomes improve. Put differently, these families experience poverty throughout the year, even if their annual incomes exclude them from official estimates. The single mother we described above is likely no different. After several consecutive months with little to no income support, she likely experiences poverty, even if our data suggest that the CARES Act puts her over the poverty threshold for the year.
The income volatility dilemma has clear implications for how we structure benefit provisions. For real families, the timing of income support is critical. For the mother who lost her job after the onset of the crisis, it matters whether the income support arrives in March rather than June; for the researchers evaluating her annual poverty status, it makes no difference. The CARES Act magnifies this distinction due to both the size and timing of the payments. The amount of income transfers distributed between March and July 2020 is without precedent, but state administrative challenges have delayed the receipt of income support for millions. That said, concerns of policy-induced income volatility are not unique to the CARES Act or the present crisis. The Earned Income Tax Credit (EITC) and Child Tax Credit (CTC) also provide benefits on a single-payment basis, lumping thousands of dollars in income support into a once-per-year payment around tax time. Even if these refundable tax credits were measured perfectly in our income data (they are not), evidence suggests that annually-distributed allotments of funds lead to different consumption outcomes compared to monthly cash support. Studies evaluating how families spend their EITC, for example, find that much of it goes toward debt and bills.
The standard defense for the EITC and other one-time or concentrated transfers is a simple one: consumption smoothing. The single mother described above, some argue, should save some of that $9,000 she receives in July to smooth her consumption over subsequent months. But there are two major problems with an uncritical resort to the consumption smoothing argument. First and most obviously, many low-income families cannot smooth consumption backwards. Put differently, what does our example family do in May, a month without income, while awaiting unemployment benefits that arrive in June? Debt-financed consumption is an option for some, but that debt doesn’t show up in our income data, further complicating our assessments of poverty.3
Second, consumption smoothing is increasingly challenging when the number of months over which you must smooth is unknown. Consider that the Congressional Budget Office projects an unemployment rate of around 10 percent to persist through the end of 2021. Our single parent would have an easier time smoothing consumption if she knew she could go back to work in August. However, many of the recent unemployed do not have the luxury of knowing when their next paycheck will arrive.
There is an obvious solution to this trend of policy-induced income volatility: deliver cash assistance to families on a regular basis throughout the crisis (and beyond). In the absence of quick policy change, however, we’re left with a patchwork welfare state and a mix of indicators for understanding how families are coping.
In addition to annual income, scholars have projected trends in food insecurity, an acute version of material hardship. The recent data suggest that levels of food insecurity are high and rising. These indicators are informative, and may be a more useful indicator than changes in annual poverty rates during times of economic crisis. Empirically and conceptually, however, food insecurity and poverty have long been detached. The empirical evidence is presented in Figure 2, which shows the relationship between poverty status (again using the Supplemental Poverty Measure) and food insecurity averaged over 2009 to 2017.
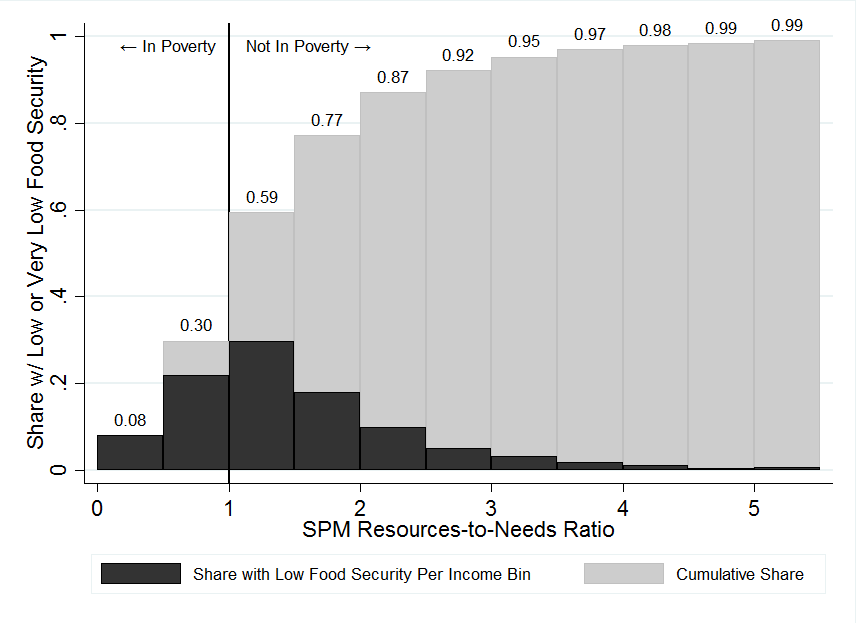
Figure 2: Share of households experiencing low or very low food security by poverty status and income bin, average over 2009-20174
The gray bars show the cumulative share of households experiencing low or very low food security (Y-axis) over the distribution of households’ resources-to-needs ratio (X-axis), with a resources-to-needs ratio below 1 indicating that the household lives in poverty. The black bars show the share of households with low or very low food security per each income bin. The conclusion is clear: only 30 percent of households experiencing food insecurity actually live with annual incomes below the poverty line. The largest incidence of food insecurity is found just above the poverty line among those with incomes between 100 to 150 percent of the poverty threshold. One-quarter of households experiencing food insecurity are above 150 percent of the poverty line.
From a conceptual perspective, the giants of poverty research might suggest that a mismatch between poverty and food insecurity is not, in itself, cause for concern. From Townsend to Atkinson to Citro, poverty scholars have long recognized that poverty is not simply a synonym for acute deprivation, but instead reflects a lack of resources necessary to “obtain the type of diet, participate in the activities, and have the living conditions and the amenities which are customary” in society. Given the volatility that the CARES Act has introduced, we’re forced to ask ourselves: is a focus on annual income still sufficient to assess whether a family meets that standard?
In 2020, following the passage of the CARES Act, the American welfare state’s collection of direct income transfers is largely composed of a one-time stimulus payment, an allocation of unemployment benefits concentrated over a four-month period, and several once-per-year tax credits that have been expanded in recent decades. The CARES Act transfers could offset increases in annual poverty rates, yet leave many families with little to no income support throughout the second half of 2020. This fact alone should challenge whether our accounting of families’ poverty status is fit for the moment.
Moving forward, poverty scholars should grapple with the following question: does an annual accounting of resources misrepresent how families actually experience poverty? If so, we should update our measurement practices accordingly.
- Stylized example represents single-parent, two-child family in state with average living costs. Parent is assumed to lose employment in March, but is unable to access unemployment benefits until June. This scenario assumes the parent receives the $600/week Pandemic Unemployment Compensation bonus through its expiry in July, but continues to receive minimum unemployment benefits through December. Figure from Parolin, Curran, and Wimer (2020). ↩
- This family type may also receive SNAP benefits, cash assistance from TANF, or other small sources of income support. These are excluded from the stylized example for simplicity. ↩
- For more on debt and poverty measurements, see: Short (2005) and Scott and Pressman (2013). ↩
- Note: Estimates from December CPS supplement merged with corresponding households in CPS ASEC over 2009 to 2017. N=204,922. SPM resources-to-needs ratio represents a unit’s combined annual resources (including all taxes and transfers) relative to its poverty threshold, so that values below 1 indicate that the family unit lives in poverty. Food security status is measured according to the number of affirmative answers to a broad range of food security questions developed by the Food and Nutrition Service of the U.S. Department of Agriculture. ↩
Filed Under