The benefits of owning a home in the United States cannot be overstated. The housing market in the United States both reflects and causes widening cleavages in American society; owning a home is a functional prerequisite for financial security. The Federal Reserve’s latest Survey of Consumer Finances finds a massive wealth disparity based on housing status: In 2019, homeowners had a median net worth of $255,000, while renters or others had a median net worth of merely $6,300. While it is apparent that homeownership has vital economic impacts on individuals as well as the aggregate economy, evidence shows that the United States has yet to recover the total housing wealth lost during the Great Recession.1 The US Census Bureau’s historical tables on housing vacancies and homeownership confirm that the decline in homeownership is also evident for young adults. From the first quarter of 2007 to that of 2019, the homeownership rate for individuals under 35 years of age declined by 15 percent, dropping from 41.7 percent to 35.4 percent.
Over this same period, ever increasing tuition and fees, worsening income inequality, and shrinking state funding for higher education has burdened an entire generation with unprecedented amounts of student loan debt. While the student debt crisis is a topic of much research—well documented in previous posts in the Millennial Student Debt project—few have studied the impact of this crisis on homeownership among young adults. Through analyzing a ten-year range of credit bureau data (2009–2019) for student loan borrowers between the ages 18 and 35, we explore the trends of homeownership for borrowers of student debt and the relationship between homeownership rates and student loan debt balances.
Overall, our research shows that the homeownership rate for young adults with student debt has declined over the last ten years. Additionally, we find that individuals with higher amounts of student loan debt are less likely to be homeowners, especially among relatively high-income borrowers. This finding is particularly troubling as growth in median student loan debt has outpaced that of median income levels. The divergence in student debt and median income is apparent for all borrowers but is especially pronounced for those living in Black-plurality communities.2 We also find that, despite having the lowest initial homeownership rates, individuals living in predominantly Asian, Black, and Latino communities also experienced the biggest declines in homeownership from 2009 to 2019. In addition to student loan debt, there are many other factors that may affect homeownership among young adults in recent years, for example, escalating home prices and increasing preferences for mobility over stability. These explanations deserve attention and inquiry but are beyond the scope of this post.
It seems clear that those who bear more student loan debt are, all other things being equal, less likely to become homeowners. But there are many skeptics who contest the hypothesis that the recent decline in homeownership rates can be partly attributed to rising student loan debts. Some of these skeptics, relying on studies that use old data that fail to capture the recent developments in student loan debt, claim that increased student loan borrowing has had no effect on homeownership rates; others argue that there’s no way to reduce the amount of student debt people have without also curtailing their access to higher education, so inferring a correlation between student loan debt and homeownership, even controlling for income and/or education, is difficult. Contrary to these positions, our analysis of the relationship between student debt and homeownership—using the most up-to-date and robust data available—shows that rising student loan debt is preventing borrowers from purchasing homes. Moreover, we see that the adverse effects of student loan debt on homeownership are most evident for relatively high-income borrowers whose debt balances are increasing over time. Lower-income borrowers face an additional barrier to homeownership, due to restricted access to credit. While college is still the primary means by which people can secure and improve their socioeconomic status, the rise in student debt constitutes a major obstacle to purchasing a home—a step which, particularly in the United States, many consider essential for long-term financial stability.
Data
For this project, we used a dataset that consists of individual credit bureau cross-sectional data linked to demographic data reported from the American Community Survey using the individual’s US Census Tract. For the cross-section data, one million borrowers between the ages of 18 and 35 were independently sampled in each year from 2009 to 2019. For the purpose of this study, we only analyzed borrowers who had an outstanding student loan balance of $500 or more.3 From these yearly samples, we analyzed consumer-level data relating to student loan debt, mortgage debt, total debt, and debt-to-income ratios.4 All dollar values were adjusted for inflation and are presented in 2019 dollars.
Analysis
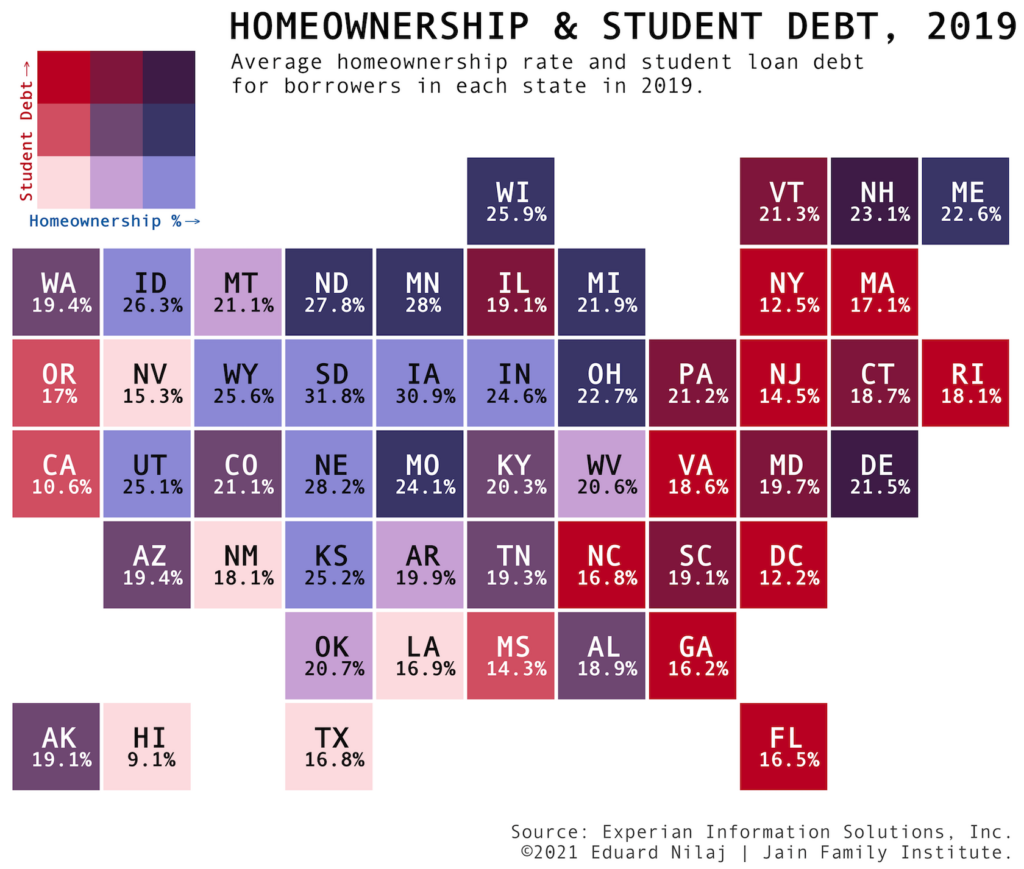
Overall, we find that borrowers with more student loan debt are less likely to be homeowners. We show this at the state level in Figure 1, which maps the homeownership rate and average student loan debt of each state in 2019. Among states with the highest average amount of student loan debt, the majority have the lowest homeownership rates, while those with lower average student loan debts have higher homeownership rates.
Looking at the ten-year trend, we find that the homeownership rate among student borrowers, measured as the share of individuals who have an outstanding mortgage debt balance,6 declined by 24 percent from 2009 to 2019. This decline is present across all borrowers, but, as shown in Table 1, the most negatively impacted borrowers lived in Asian- and Black-plurality US Census Tracts, where the rates have declined by 47.7 percent and 40.6 percent, respectively.7 Overall, we see that our sample of student loan borrowers in 2019 have a significantly lower homeownership rate (18.6 percent) than that of all households under 35 years of age (35.4 percent).8
| Race | 2009 | 2019 | Percent Change |
| Asian | 16.6% | 8.7% | -47.7% |
| Black | 16.8% | 10.0% | -40.6% |
| Latino | 17.9% | 11.8% | -33.9% |
| White | 28.4% | 21.2% | -28.4% |
| Other | 7.6% | 6.3% | -26.1% |
What are the other characteristics of the borrowers who have experienced declining homeownership rates? First, we look at homeownership rates from 2009 to 2019 for borrowers with varying levels of total student loan debt and total estimated income, all in inflation-adjusted 2019 dollars.
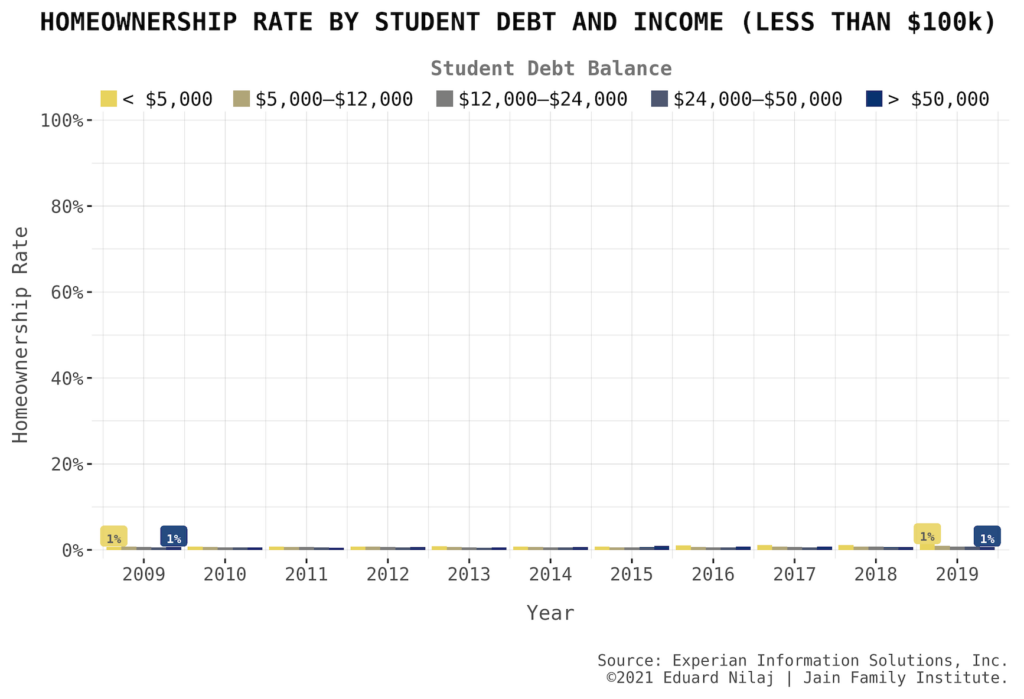
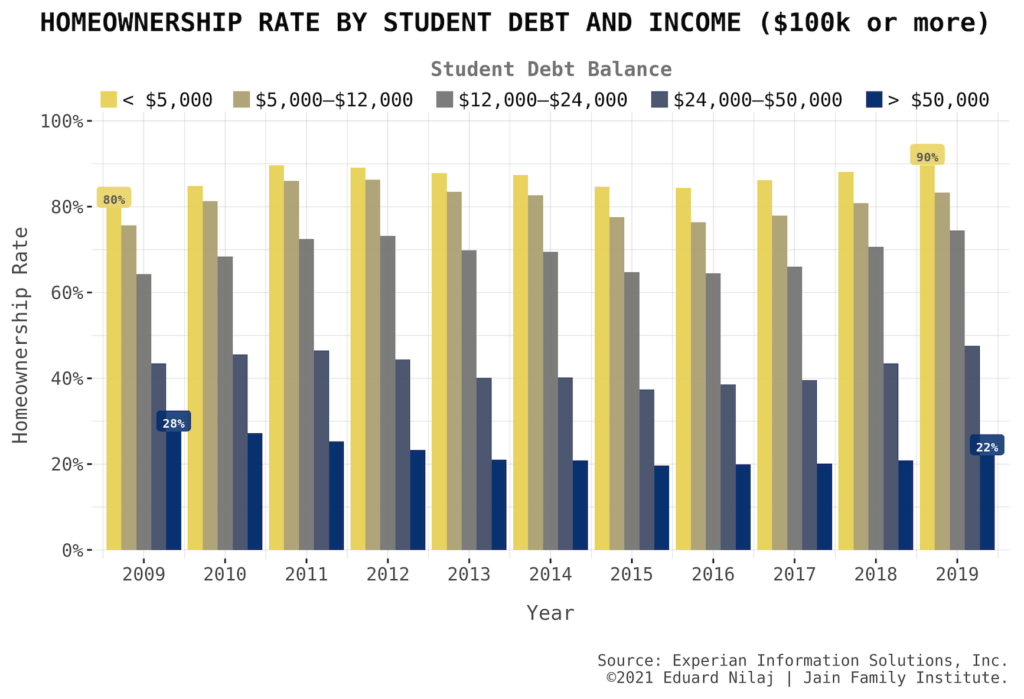
Figures 2 and 3 show average yearly homeownership rates for five different levels of total student loan debt. Most strikingly, we find that the homeownership rate for borrowers with estimated incomes of less than $100,000 (Figure 2) never goes above 1.2 percent in the ten-year span. Compared to an overall homeownership rate of 35.4 percent for under-35-year-olds, the extraordinarily low homeownership rates for student debtors with lower incomes in this age cohort is striking—and aligns with research that shows declining homeownership for young adults at the lower end of the wealth and income distribution. When examining borrowers with estimated incomes of $100,000 or more, we are able to clearly discern a relationship between debt and homeownership. In each year of our study, higher student loan debt corresponds with lower homeownership, and the homeownership rate gap widens for each increasing level of student loan debt.
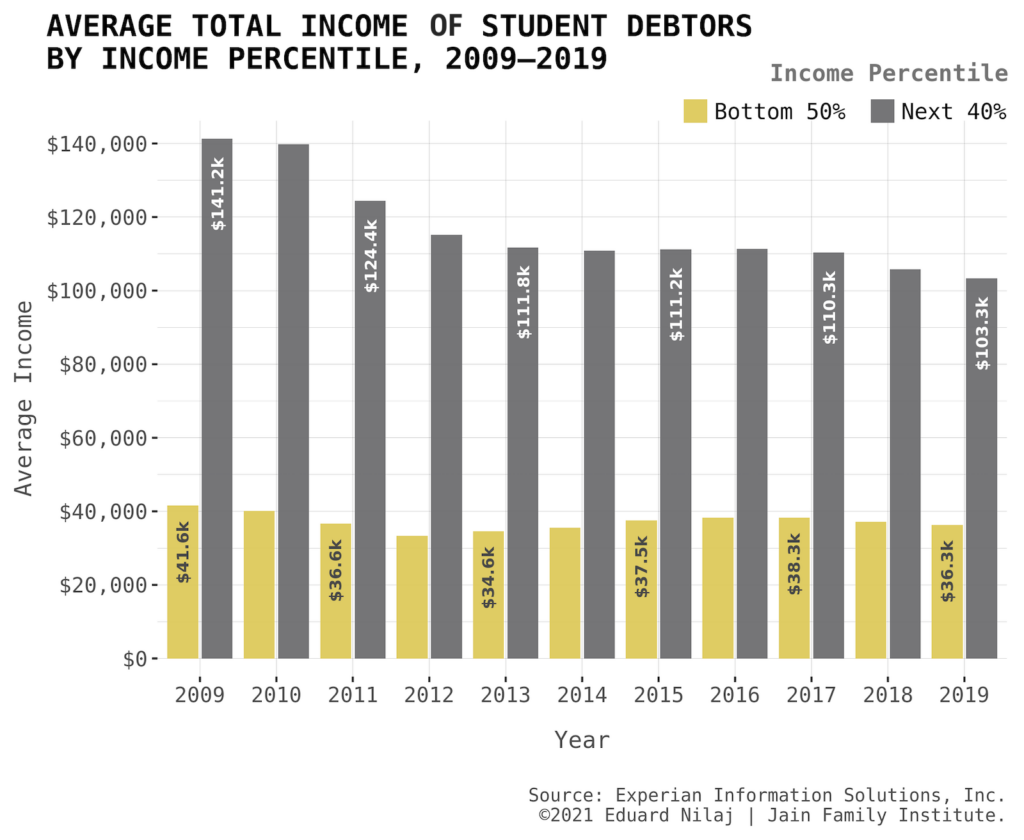
In conjunction with these trends, we find that recent cohorts of student loan borrowers also have lower estimated incomes than their predecessors. In 2009, 42 percent of our independently sampled 18- to 35-year-olds had an estimated income of $100,000 or more; in 2019, that share was slashed to 31 percent. In fact, Figure 4 shows the yearly shift in cohort income by comparing the average income of the bottom 50 percent and the next 40 percent (51st to 90th percentiles) of the income distribution for each year we sampled. The average income for the bottom half of the income distribution decreased from $41,600 in 2009 to $36,300 in 2019. For the next 40 percent of the distribution, the average dropped from $141,200 to $103,300. These findings are consistent with research showing that returns on education are not being realized.10
Several troubling implications flow from these findings. First, the student borrower population is getting poorer, meaning that borrowing for college becomes more prevalent, sustaining repayment becomes more difficult, and affording a mortgage becomes nearly impossible. Second, the “earnings premium” assumption justifying student debt loads is increasingly misguided; a more holistic approach that incorporates more than just income—for example, owning a house—illustrates how student loan debt can have negative repercussions even for upper-middle-class borrowers. Third, because of persistent racial wealth disparities, Black students end up borrowing more—in aggregate and in relation to income—than white students to attend college. And despite being credentialed with college degrees, certain demographic groups still suffer the consequences of wage inequalities—the returns on a college education vary for different racial and income groups. For additional confirmation, we revisit Table 1 and see that Asian-, Black-, and Latino-plurality census tracts all saw massive decreases in homeownership rates—greater than their white counterparts.
For a more in-depth analysis of the intersection of student loan debt, homeownership, and total income, we examined homeownership by the distribution of student debt for individuals in three income percentile categories in 2009 and 2019. We independently calculated student debt percentiles for each year and assigned a percentile to each borrower. We then grouped the borrowers by their estimated income and assigned one of the three income groups to each individual. Lastly, for both years, we plotted the average homeownership rate for the three income groups for each student debt percentile, as shown in Figure 5.
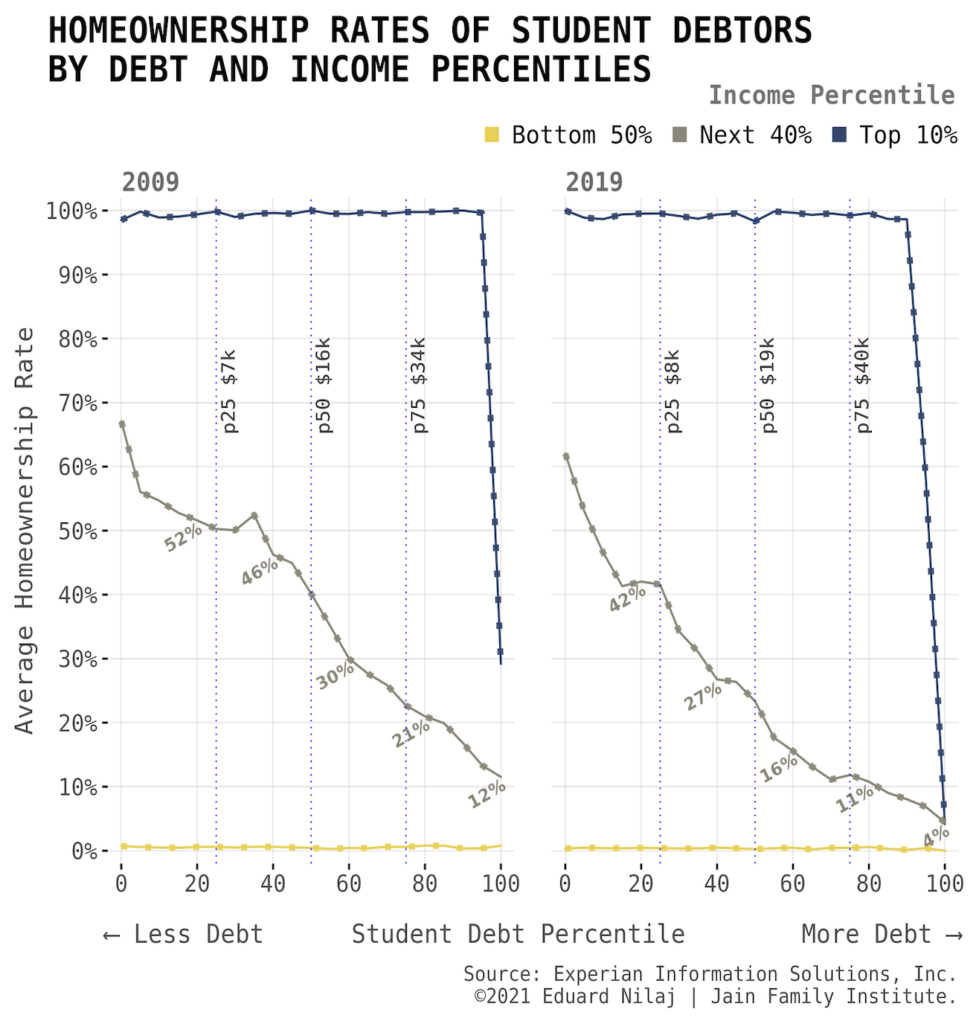
First and foremost, we note that homeownership is virtually nonexistent for the bottom half of the income distribution in 2009 and even more so in 2019. In addition to having lower rates overall, the decline in homeownership, as total student debt percentile increases, is more present in 2019 than in 2009 for all income groups. For the next 40 percent of the income distribution (51st to 90th percentile), we see very noticeable differences when comparing the two years. In 2009, the average homeownership rate for this group remains above 50 percent until the student debt percentile increases to 40, after which the rate declines at a quicker pace and approaches 20 percent around the 80th student debt percentile. In 2019, the decrease in homeownership for the next 40 percent of the income distribution is apparent and drastic at very low percentiles of student debt. Here, we see the homeownership rate dipping below 50 percent around the 10th student debt percentile, and below 30 percent prior to the 40th student debt percentile.
This grim picture becomes bleaker when one considers that the share of borrowers with high volumes of student debt is growing, while the group of borrowers amassing that debt is increasingly less affluent than preceding cohorts. From 2009 to 2019, the median estimated income of our sample of student debtors shrank by 22.8 percent, dropping from $82,765 to $67,364. Despite the reduction in income, the median student debt balance for the bottom half of earners increased by nine percent from 2009 ($10,100) to 2019 ($11,000). Further, from 2009 to 2019, the share of borrowers with student debt balances of at least $25,000 increased by 19 percent, with 41 percent of our sample having an outstanding student loan balance of $25,000 or more in 2019. Figure 6 illustrates these shifts by comparing the 2009 and 2019 shares of borrowers by their income group and total student debt. We see that, in addition to being less affluent, the bottom half of earners have a disproportionately larger share of student debt in 2019 than in 2009.
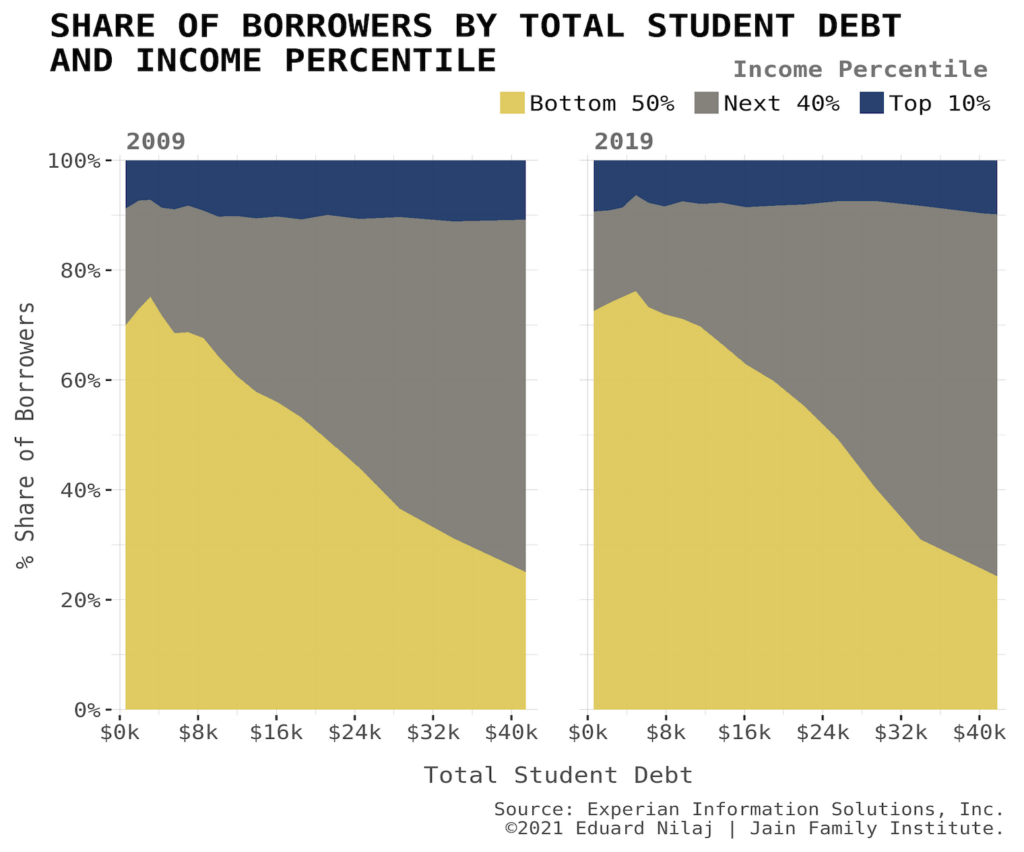
Note: The x-axis was capped at $42,000 for viewing purposes; over 75% of both samples fall within this range.
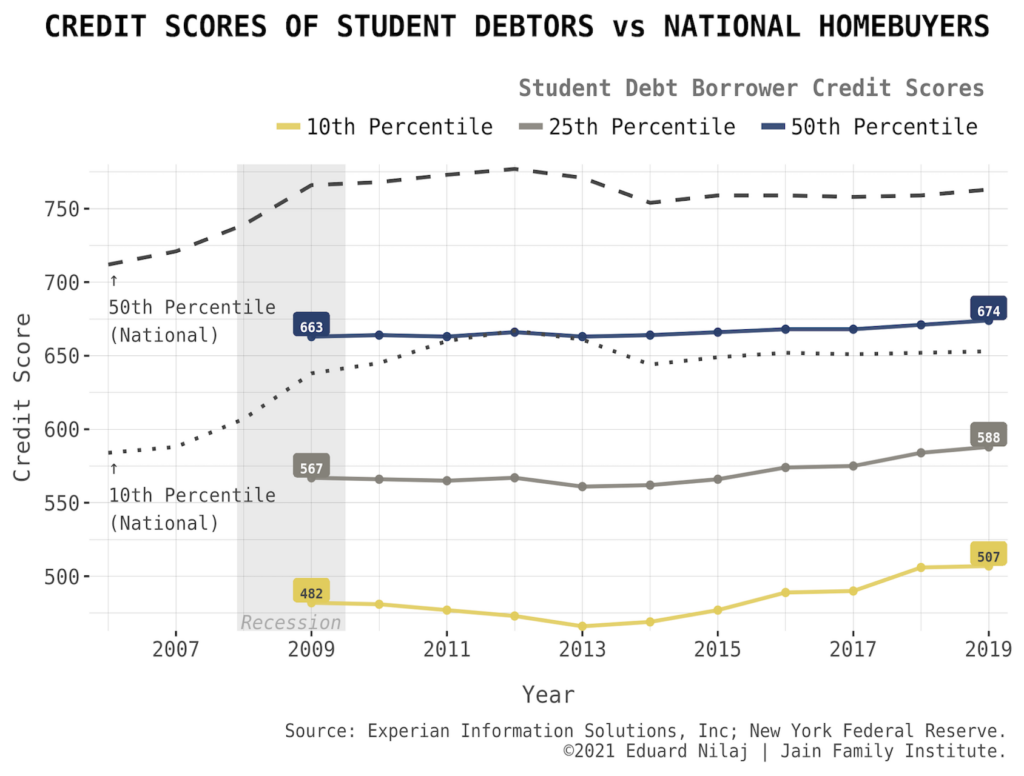
These trends did not occur in a vacuum, but alongside a severe credit crunch. In the housing boom cycles of the early 2000s, the median homebuyer in the United States had a credit score of around 700, and the bottom 10th percentile homebuyer had a credit score of under 600. With a boom in construction and a secondary market ready and willing to purchase mortgage-backed securities (MBS), lenders were eager to get loans out the door to prospective borrowers. The results of this boom are well known.
As the post-2008 recovery began, regulatory changes and risk mitigation practices cut the legs out from potential homeowners with lower credit scores. While lenders are culpable for making loans to people who would struggle to pay, these changes excluded most student debtors from the housing market. Figure 7 illustrates how the rise in credit score standards for lenders effectively shut out all but a small portion of student debtors in the US.
Conclusion
The housing market was destined to tighten post-recession—it was only a matter of time before young Americans with student debt felt the pinch. While it’s undeniable that lower income and wealth affects one’s ability to afford a mortgage, controlling for income reveals that the scale of student debt matters as well. While a decline in homeownership is just one of the many concerning trends shaping the lives of young Americans, its pervasiveness may signify a new normal. Rather than paying a mortgage for a house, young people pay student loans debts that are mortgage-like, both in the scale of outstanding balance and length of term. The position that student debt is “good debt” because of a college earnings premium remains untenable. The number of borrowers shackled with student debt continues to rise, leaving many with nonexistent and even negative returns on their debt-financed education. Policy responses have only muddled the issue, placing the burden on individuals to choose the best college, degree, program, loan, and repayment plan (and adhering with the complicated fine print). Meanwhile, forgiveness programs are fruitless, any guardrail in place to increase college accountability and quality is litigated for years, as are claims of fraud, and predatory for-profits simply rebrand, while punishments for bad behavior are nil.
As the negative consequences of rising student loan debt seep into various aspects of life, many borrowers share a feeling of hopelessness, and with good reason. Despite the shady practices of colleges and universities and the concerning trends highlighted in this report, debt-financed higher education remains the default accessible avenue for upward mobility. But its promise of American mobility has broken down: Increasing student loan debts since the Great Recession are impeding young adults from becoming homeowners. The new generation of borrowers is more diverse and less affluent, and absent debt cancellation programs, the decline in homeownership is likely to linger, with lasting effects on economic inequality and housing rippling across the nation.
Special thanks to Laura Beamer, Sérgio Pinto, Marshall Steinbaum, and Paul Williams for their excellent comments and expertise.
The 2019 Survey of Consumer Finances shows that real total housing wealth was still 13% lower than in 2007, before the Great Recession.
↩Figures 5 and 6 in Student Debt and Young America.
↩With this restriction, our average yearly sample size was 809,625 student debt borrowers.
↩We estimated total income for everyone using their total debt and debt-to-income ratio. We also want to note we were only able to estimate total income for roughly 95% of our yearly samples as many borrowers had missing information for total debt and/or debt-to-income ratio.
↩The lightest color (bottom-left in the legend) corresponds to the lowest homeownership rates as well as lowest student loan debts; the darkest color (top-right) illustrates the highest rates and student loan debts. The states with the lowest homeownership rates and highest average student loan debts are illustrated in bright red.
↩In taking the presence of a positive mortgage debt balance to indicate homeownership, we fail to include individuals who own their homes outright as homeowners. But given that the median age of first-time home buyers was at record highs in 2019 and that only about a third of homeowners fully own their homes, we believe that this represents a very small share of our sample and does not have any significant effects on our findings.
↩The credit bureau data we used does not include variables on race at the individual level. This analysis uses the census tract reported for borrowers matched to a race categorical variable, which took the values of Asian, Black, Latino, White, Pacific Islander, Native Alaskan, or Native American depending on the racial plurality of the census tract’s population data. Census tract data is sourced from the Census Bureau’s American Community Survey 5-year estimates for each particular year in our sample.
↩Estimate in the US Census Bureau’s quarterly vacancies and homeownership report, first quarter 2019.
↩This table uses the data of borrowers whom we were able to link to ACS census-tract-level racial demographic plurality, which we use to impute that borrower’s race. We were able to impute race for over 99% of borrowers in the 2019 cross-section sample; however, due to missing geospatial data, we could only impute race for 81% of the borrowers in the 2009 sample. “Other” was assigned to borrowers who lived in tracts where the racial plurality was not one of the top four groups or where a plurality did not exist.
↩Julie Margetta Morgan and Marshall Steinbaum, The Student Debt Crisis, Labor Market Credentialization,
↩
and Racial Inequality: How the Current Student Debt Debate Gets the Economics Wrong, Roosevelt Institute, October 2018.
Filed Under