Analysis
During the nineteenth and early twentieth centuries, US patterns of business and employment created huge auto, steel, and electrical products manufacturing complexes in cities like Detroit, Pittsburgh, and Chicago. In the latter half of the twentieth century, this manufacturing dominance gave way to that of large distribution and retail corporations: a slow transformation of market structures from those in which goods were “pushed” to market in large batches to those wherein goods are “pulled” to market by retailers with access to vast point-of-sale data.
The ability of retailers to dictate terms to manufacturers inverted the post-war power dynamic. In that previous era, all of the large employers were in manufacturing; today, they are mostly a mix of retail and parcel companies, whose core strength is in large part in their logistical capacities.
| Top 5 Largest Employers in the United States, 19551The total US civilian workforce in 1955 was about (<)a href='https://www.bls.gov/cps/aa2011/cpsaat01.htm'(>)74 million(<)/a(>). In 2025, it’s about (<)a href='https://fred.stlouisfed.org/series/CLF16OV'(>)171 million(<)/a(>). | Top 5 Largest Employers in the United States, 20252The total US civilian workforce in 1955 was about (<)a href='https://www.bls.gov/cps/aa2011/cpsaat01.htm'(>)74 million(<)/a(>). In 2025, it’s about (<)a href='https://fred.stlouisfed.org/series/CLF16OV'(>)171 million(<)/a(>). |
|---|---|
| General Motors – 576,667 employees | Walmart – 1.6 million employees |
| US Steel – 268,142 employees | Amazon – 1.1 million employees |
| General Electric – 210,151 employees | Target – 440,000 employees |
| Chrysler – 167,813 employees | Home Depot – 419,600 employees |
| Exxon Mobil – 155,000 employees3Ford did not reply to Fortune’s survey that year, but it would have been in the top 5, edging out Exxon Mobil, had they responded. | Kroger – 409,000 employees |
What are the twenty-first-century equivalents to the vast concentrations of labor and capital that characterized the old manufacturing economy? Just as manufacturing prowess lay in bringing together diverse operations under centralized control and mechanizing as much of the total process as possible, logistics too can be automated and agglomerated. Supply chain scholars have noted that the tendency toward logistical agglomeration produces economies of scale and raises profitability through “mechanisms such as information sharing, intermediate input sharing, technology spillover, and resource acquisition.”
Among transport geographers, such agglomerations of wholesale and retail inventory around transportation systems have come to be known as “logistics clusters.”
Sometimes this term refers to single logistics parks, like Logistics Park KC, with 15.5 million square feet of warehouses and growing. It might cost a bit more to rent space in their park than a mile or two outside of it, but corporate tenants there can save by sharing maintenance, trucking, and janitorial services and benefit from being close to a big intermodal yard. CenterPoint Intermodal Center in Joliet and Elwood, Illinois is the largest such instance of a logistics park in the United States, processing more than 3 million twenty-foot equivalent units every year—roughly the same as the ports of Seattle and Tacoma combined.
Other times, the term indicates much larger projects like AllianceTexas in Fort Worth, the fruit of a unique public-private partnership that is a whole planned community involving more than 60 million square feet of commercial space. And sometimes the term applies to entire logistics-oriented cities or regions, like Memphis or the Inland Empire.
All are forms of agglomeration, but the significance of each is varied. In addition to the costs of commercial rent, the presence of intermodal rail facilities, major freeways, land availability, and so on, one of the most important factors determining the degree of economic agglomeration in logistics is the tightness of the regional labor market. For organized labor, these clusters are crucial. There are some facilities that large employers will shutter at the first sign of labor trouble; others that would cause them great pain to close or move, like those fixed around cargo airports or intermodal yards. Focusing in on logistics clusters, and understanding the reasons behind such clustering, allows labor organizers to better identify strategic targets. It also allows us to spot architectonic shifts in a company’s strategy.
Ten US logistics clusters
Thanks to data I have accumulated on the distribution networks of the largest employers in the United States, it is possible to delineate a useful middle ground between single logistics parks and whole logistics-oriented regions: concentrations of large employer distribution facilities within a set area.
In this map, I have included all distribution facilities where at least 400 people work (according to OSHA’s 2024 Injury Tracking Application data) of eleven of the fifteen largest private employers in the country. (The other four are Berkshire Hathaway, UnitedHealth, HCA Healthcare, and Allied Universal; the latter three do not have prominent logistical footprints, while Berkshire Hathaway does but primarily through its subsidiary McLane.) Since Amazon, UPS, and FedEx are all on this list, I also included similar nodes for the United States Postal Service.4All of the underlying data for this map can be found (<)a href='https://docs.google.com/spreadsheets/d/1OLgEOVSQDZ9G82_xgATAzPxRi99VEJ2mjM3dtJ41-MI/edit?usp=sharing'(>)here(<)/a(>).
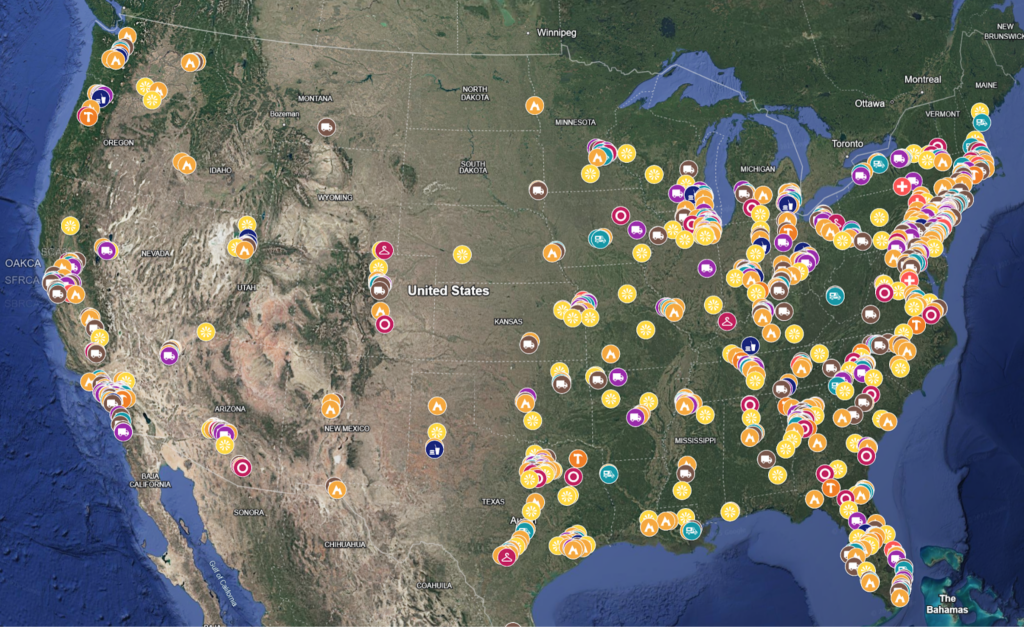
If we define a logistics cluster as any group of at least nine large employer distribution facilities with at least 400 workers within a thirty square mile area (judged through the admittedly crude method of tracing an outline around the facilities with Google’s measurement tool), then there are ten logistics clusters in the United States.
| Employer | US Workforce Size |
|---|---|
| Walmart | 1.6 million |
| Amazon | 1.1 million |
| Target | 440,000 |
| Home Depot | 419,000 |
| Kroger | 409,000 |
| UPS | 406,000 |
| FedEx | 370,000 |
| CVS | 300,000 |
| Albertsons | 285,000 |
| Lowe’s | 284,000 |
| TJX Companies | 261,000 |
| United States Postal Service | 553,724 |
I set the workforce size cutoff at 400 to mostly (though not entirely) exclude Amazon last-mile Delivery Stations. Delivery Stations are typically sited in urban settings, unlike most of the larger distribution nodes. Since we are not including Walmart or Home Depot last-mile nodes (their retail stores), it made sense to (mostly) exclude Amazon’s too. The “nine in thirty” formula was chosen inductively—this is what an examination of the map showed to be a workable definition for the largest logistics clusters in the United States. But there are many other ways to slice this cake. The data is here, and I welcome experimentation with it.
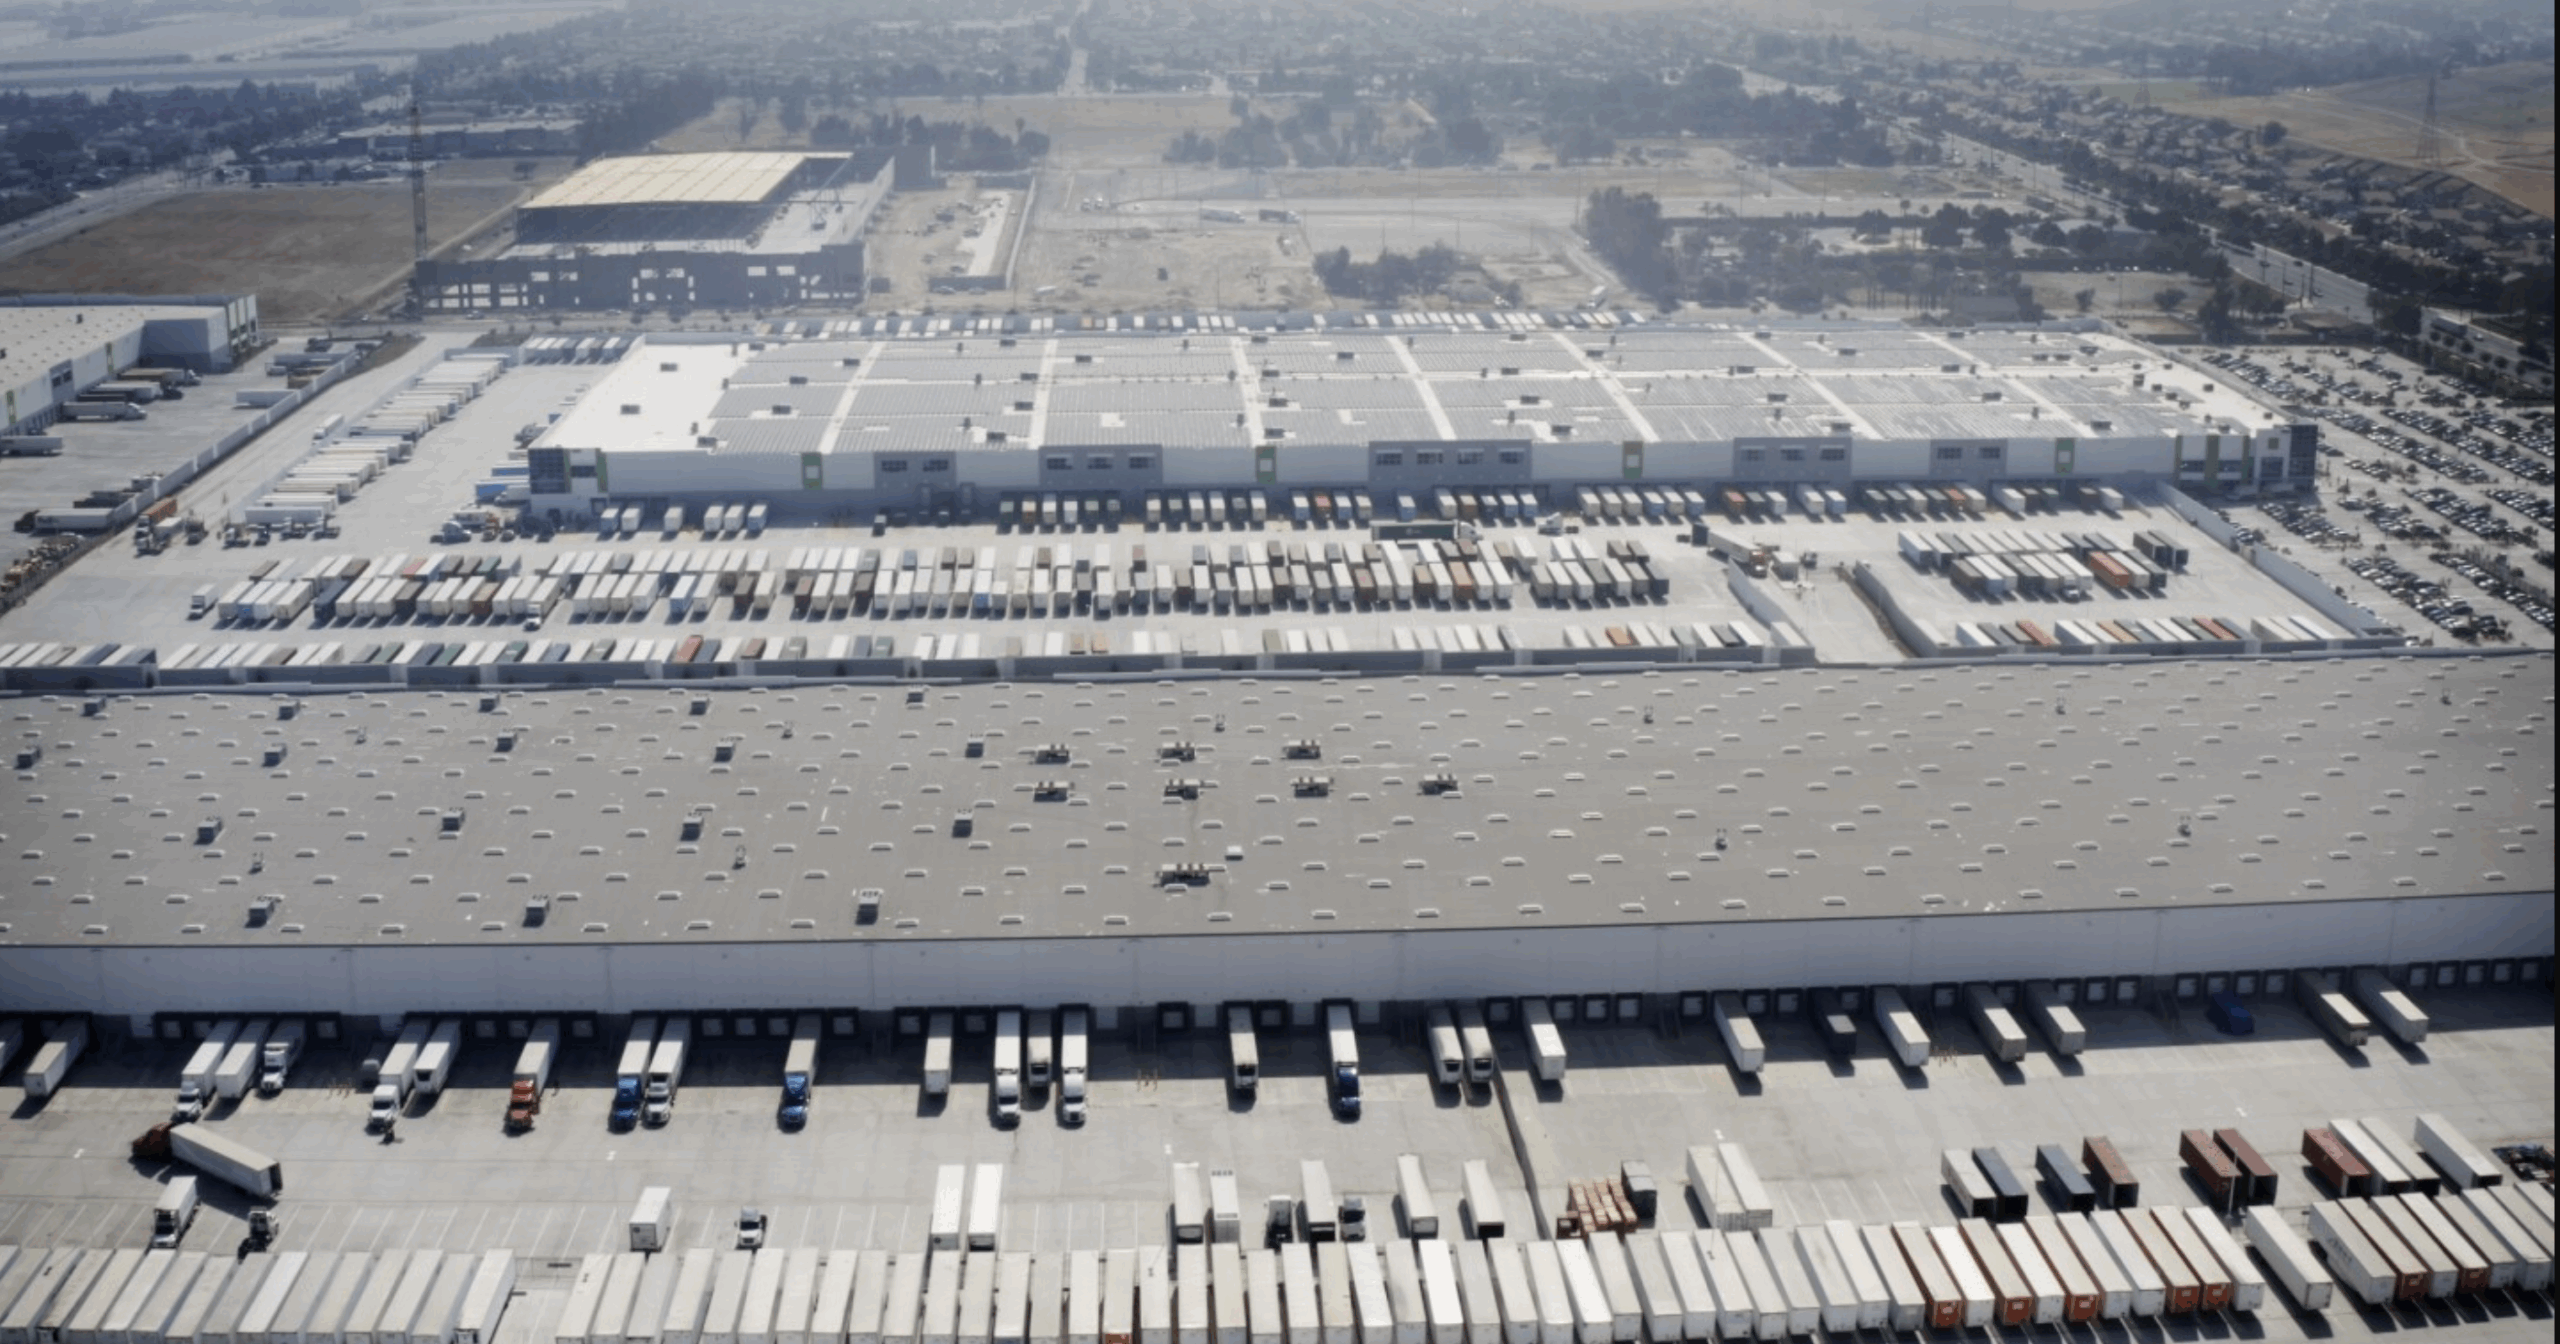
The Inland Empire
It’s difficult to overstate the logistical importance of the Inland Empire to the United States. Forty percent of all containerized imports come in through the adjacent ports of Los Angeles and Long Beach, and the Inland Empire is where the mess of goods gets sorted out. According to my data on Amazon’s Q3 2025 imports, just over half of their total volume in twenty-foot equivalent units (the standard measure of container volume in shipping) came in through LA and Long Beach.
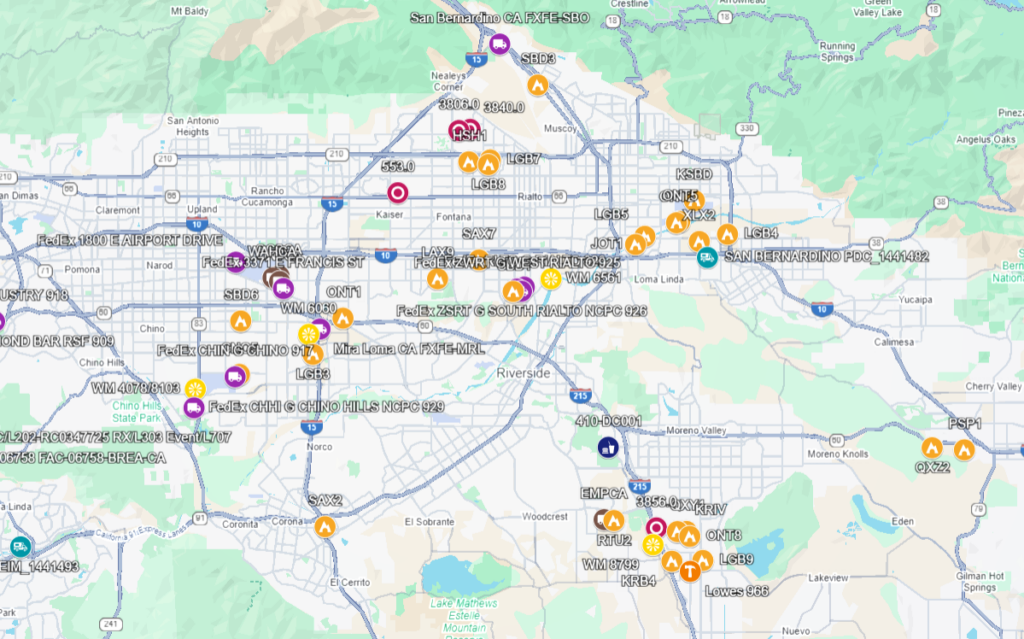
There are three logistics clusters in the Inland Empire according to the definition above. In each case, I will list the number of each company’s facilities depicted, as well as the total number of workers at the combined facilities.
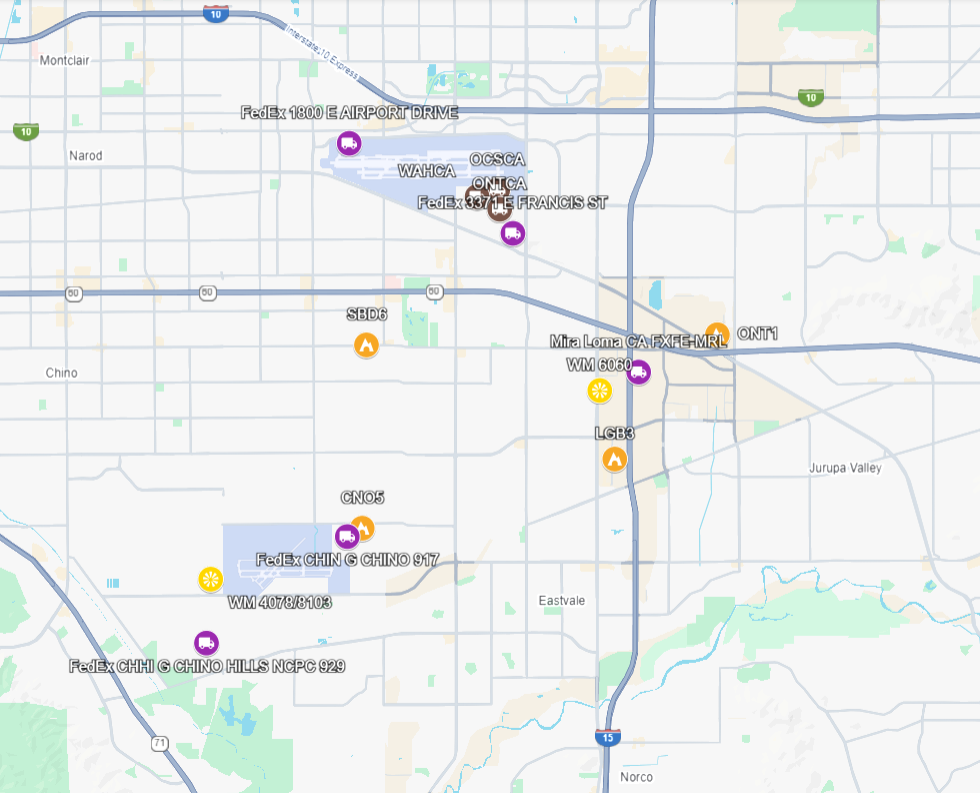
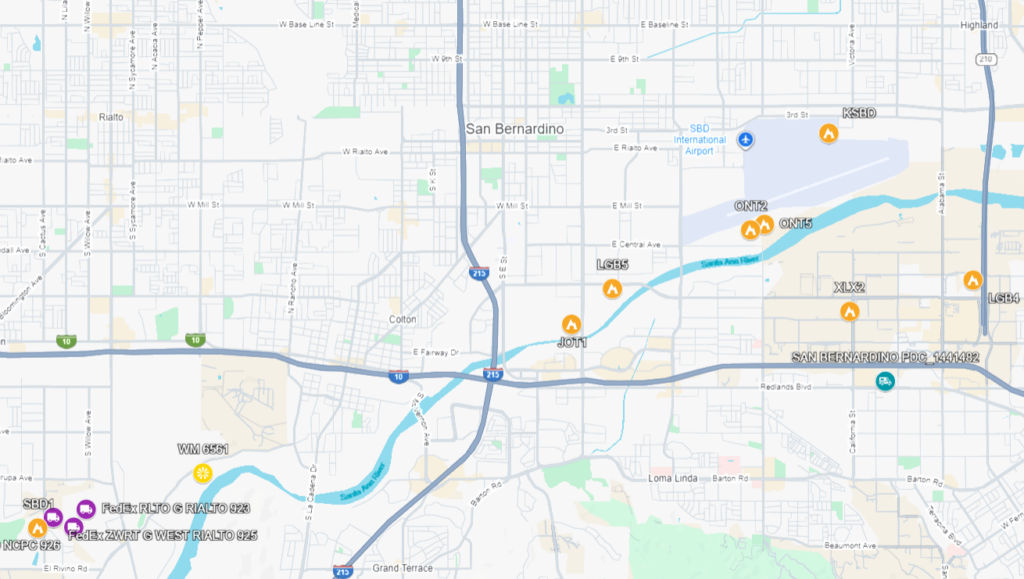
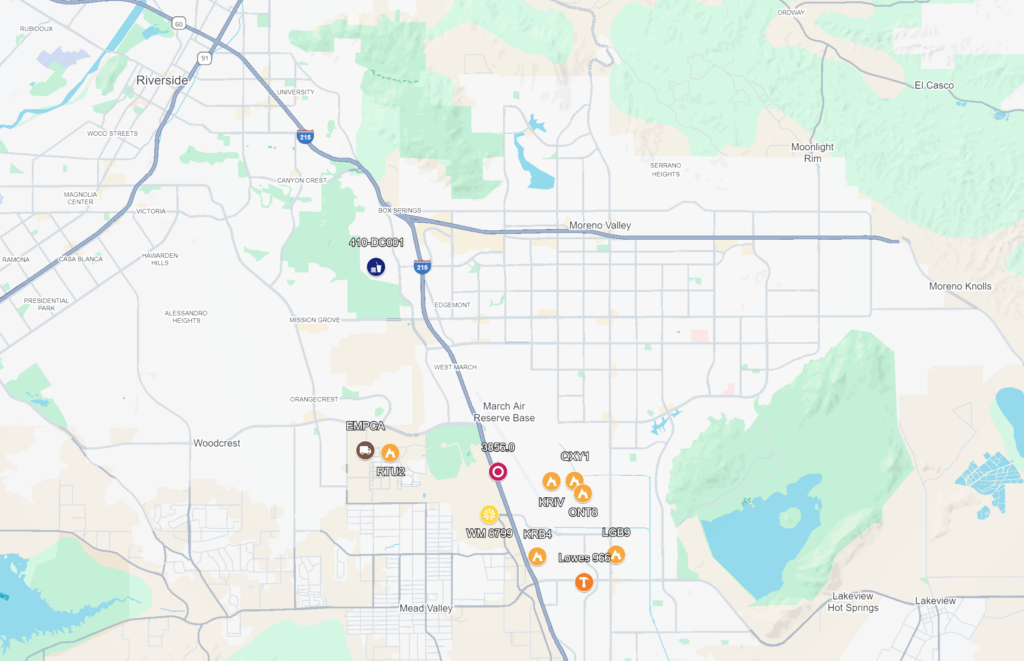
These three clusters, so close together that they almost overlap, comprise Southern California’s Inland Empire. In the roughly 620 square mile area, from Chino in the west to Beaumont in the east, from San Bernardino in the north to Perris in the south, 69,009 people work in the 400+ employee distribution centers of the large employers listed above. Amazon has 24 such facilities, where a total of 36,681 people work—meaning that Amazon is now by far the dominant warehousing employer in the region.
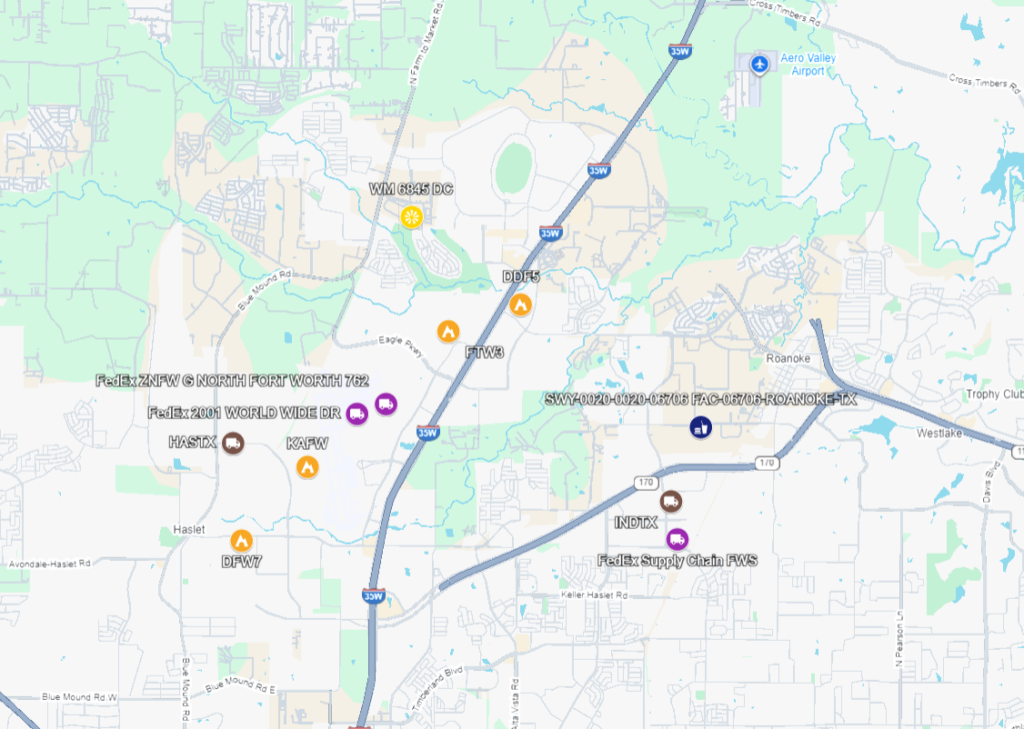
The NAFTA superhighway
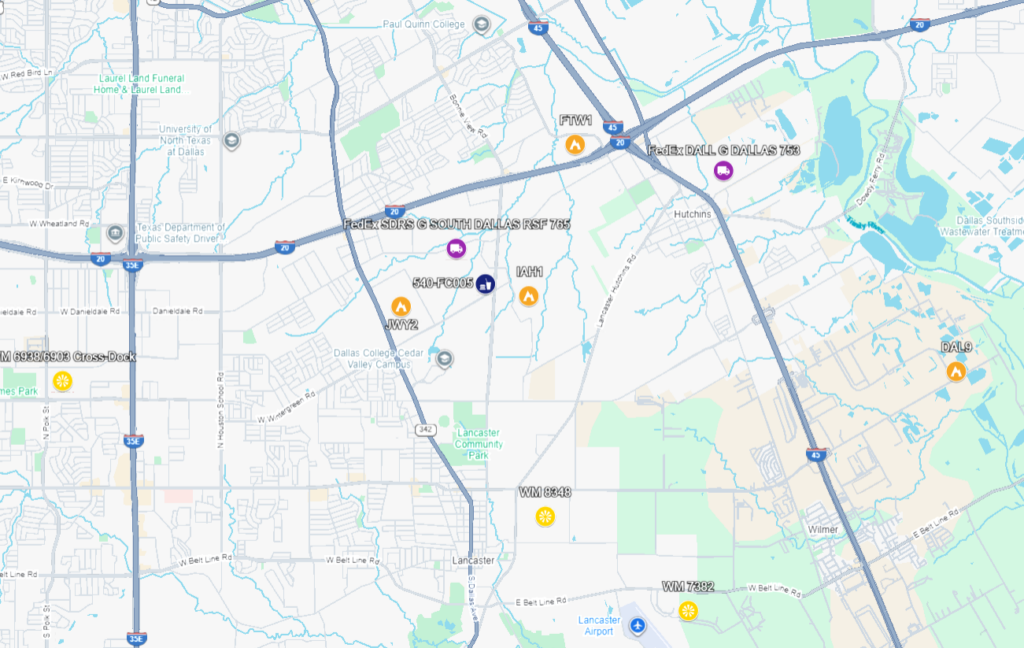
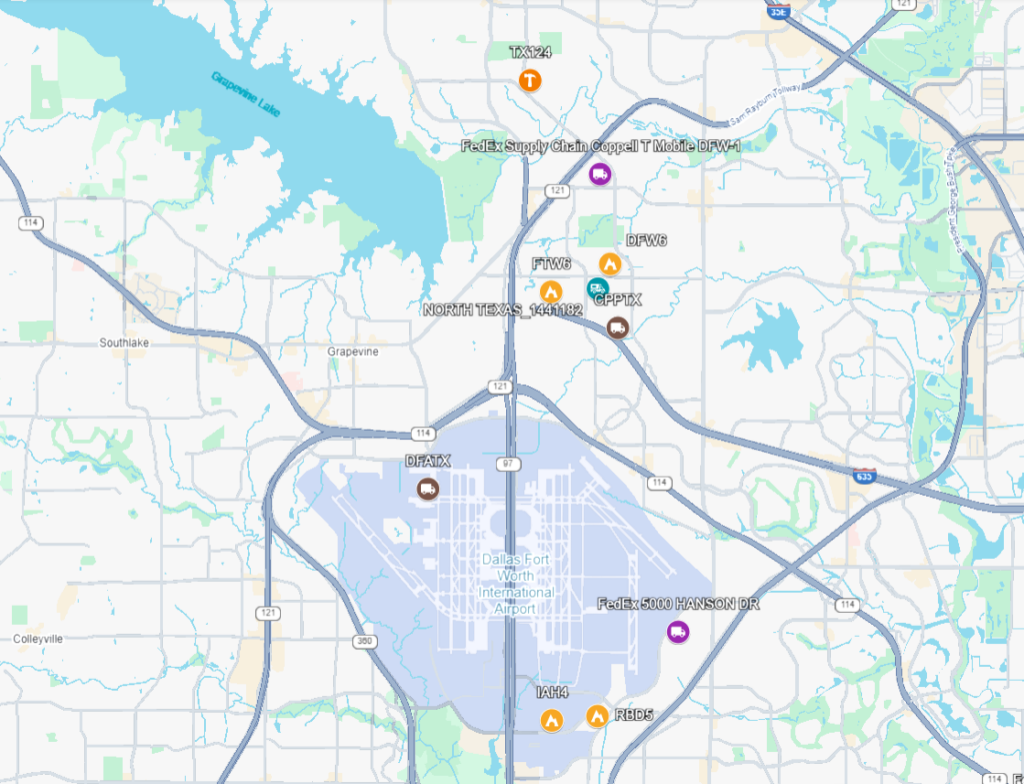
That the Inland Empire would have three of the ten logistics clusters is not so surprising. That the Dallas-Fort Worth (DFW) area would have the same number is a bit more so, but it makes sense, for a number of reasons.
DFW is the key gateway of the so-called “NAFTA Superhighway,” running up from Laredo on I-35. It’s basically at the mid-point of the country, within a two-day drive of most major metro markets, and warm enough that the winter season doesn’t significantly impact operations. BNSF has a major intermodal hub by KAFW (which is also Amazon’s secondary air hub, second in flight traffic only to its main hub in Cincinnati, KCVG), and Union Pacific has one in South Dallas close to I-45 (pictured in Cluster DFW 1).
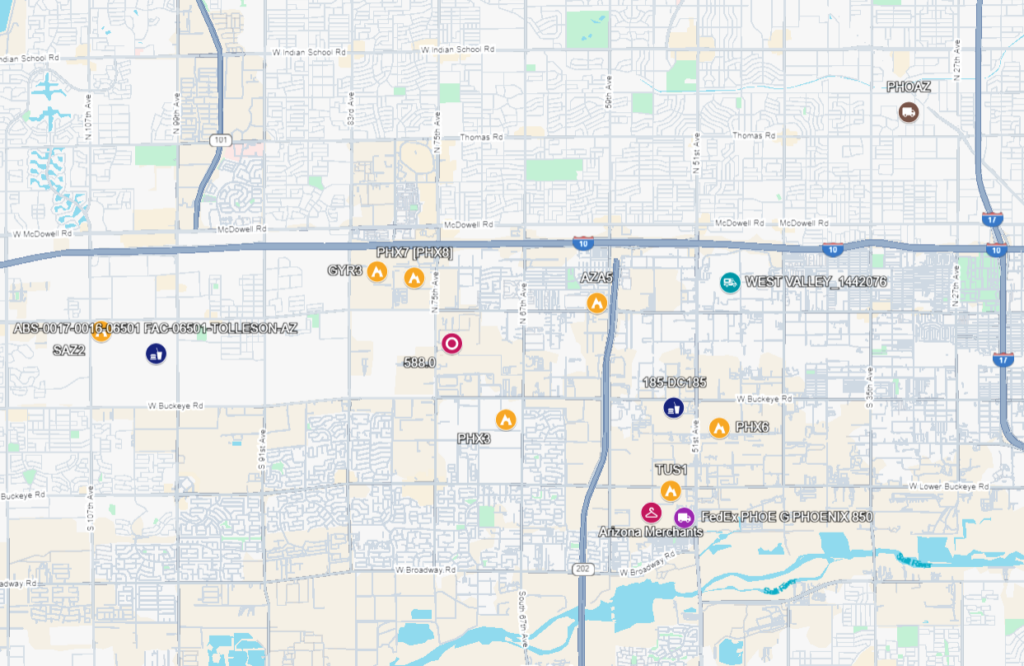
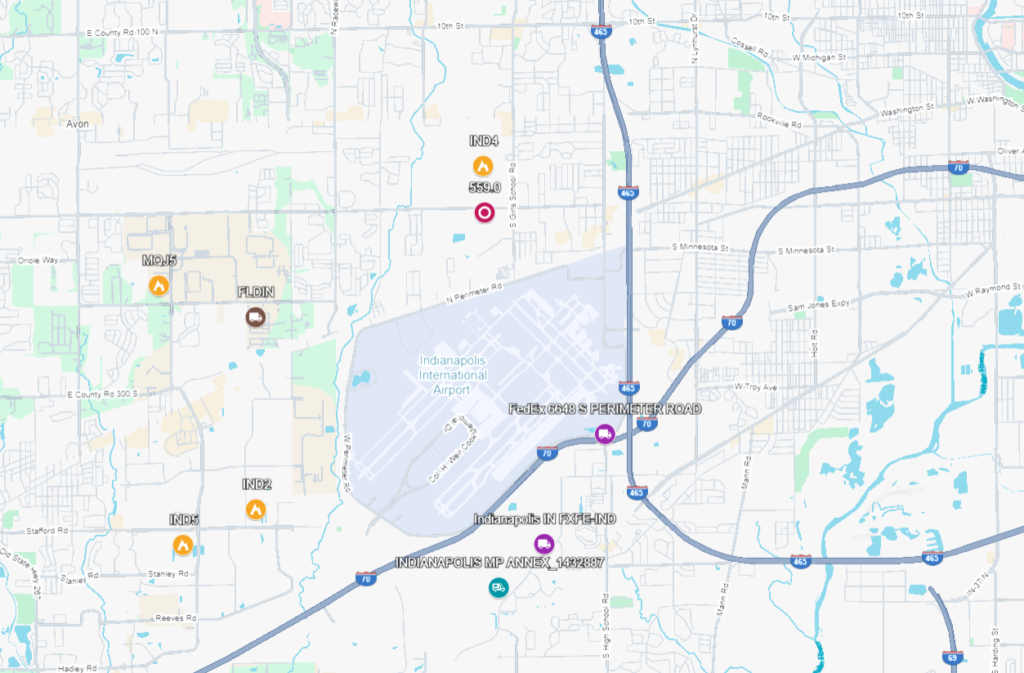
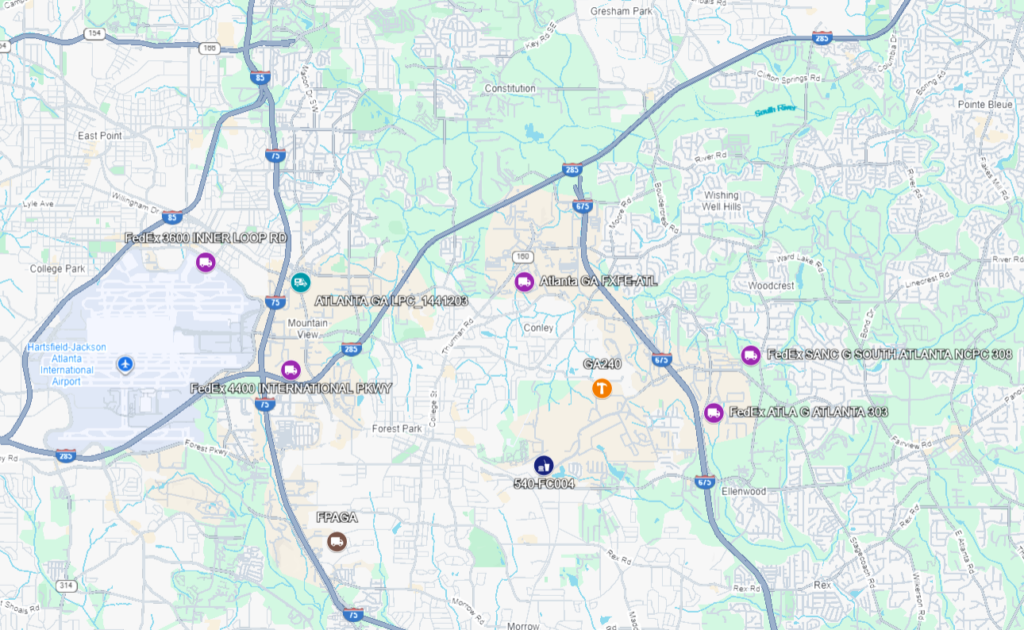
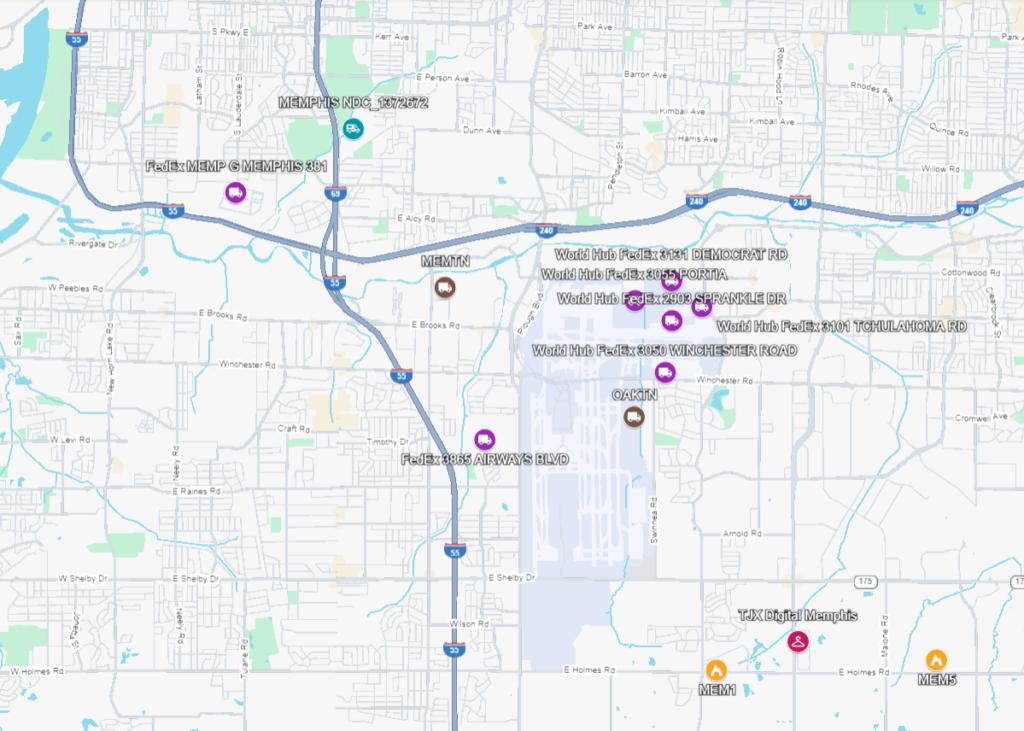
Phoenix, Indianapolis, Atlanta, and Memphis
The remainder of the logistics clusters are in west Phoenix, in Indianapolis around the KIND airport, in Memphis around the KMEM airport, and in south Atlanta. Most surprising is that nowhere in or around Chicago qualified. Chicago has traditionally served as the major freight routing point on the journey of imported goods from the west to the large east coast markets.
Labor market tightness
What matters for both business and labor about these places are primarily two things: first, labor market tightness and, second, operational significance. The more distribution center workers already employed and the smaller the population of potential warehouse workers around a given cluster, the harder it will be for large employers to hire people at their desired levels and wages. For labor, of course, that same dynamic is an organizing boon.
For example, whenever Amazon is spying a site for a potential new distribution facility, their Workforce Staffing team analyzes the company’s potential to staff up at that location. This involves knowing the size of the potential population they’re pulling from (in other words, from how far away people are willing to drive for work), how many of those people are currently making just under the wage that Amazon is going to pay, what percentage of their potential workforce is already employed in warehousing and at what wage, and many other things that I couldn’t begin even to guess.
Unions, community organizations, and progressive policy institutes like to portray Amazon’s wages as miserably low, but they are in fact carefully calculated to be just slightly above what people in a particular region are making on average so that Amazon can staff up at its desired level. What Amazon wants is not to pay its workers as little as possible; it wants to have perfect control over its staffing levels at any given time. This is a serious science. At the annual Operations Research and Management Science conference, Amazon researchers offer plenty of presentations about robotics deployments and inventory management, but a preponderance of presentations are about “labor planning.”
Laypeople can only offer crude approximations of a workforce staffing calculation compared to a sophisticated behemoth like Amazon, but let’s say a particular cluster is pulling in workers from within 25 miles. Tallying up the number of households in zip codes within that radius that make under $45,000 per year gives some approximation of the size of these companies’ potential distribution center workforce.5Annual income for a single worker earning an hourly wage of $16 to $17 is $33,000 to $35,000, but many households have multiple workers. In turn, adding together the total number of workers in a particular cluster with those at other sites of the twelve large employers within that twenty-five-mile radius, and then dividing that by the total number of households within that radius with income of less than $45,000 per year gives some idea of the potential availability of labor to the employers in that cluster.
| Cluster | Workers in cluster | Additional workers in 25-mile radius employed by twelve large firms6These are the number of workers at large employer facilities on the map linked above that are within the 25 mile radius from the center of a particular cluster, i.e., other places potential workers could go to. | Households earning less than $45,000/year within radius | Employed logistics workers of large employers as share of low-income households within radius |
|---|---|---|---|---|
| Inland Empire 1 | 21,494 | 52,594 | 320,806 | 23.1% |
| Inland Empire 2 | 15,693 | 53,316 | 200,726 | 34.4% |
| Inland Empire 3 | 13,996 | 55,013 | 204,556 | 33.7% |
| DFW 1 | 10,544 | 25,502 | 383,971 | 9.4% |
| DFW 2 | 12,980 | 42,098 | 496,699 | 11.1% |
| DFW 3 | 12,922 | 22,716 | 318,731 | 11.2% |
| Phoenix | 17,019 | 14,953 | 348,420 | 9.2% |
| Indianapolis | 14,104 | 11,717 | 190,660 | 13.5% |
| Memphis | 28,592 | 12,776 | 161,257 | 25.7% |
| Atlanta | 6,416 | 28,411 | 341,031 | 10.2% |
Given the results here, one would expect any company opening a distribution center in the Inland Empire or around KMEM (FedEx’s international air cargo hub in Memphis) to have a more difficult time staffing up than in west Phoenix or south Atlanta. In the Inland Empire, this rough estimate of geographic labor-market tightness for the sector shows each cluster employing a population equal to about a quarter to a third of the number of low-wage households in the region. In Phoenix, the estimate is less than one in ten. Many households are comprised of multiple workers, so this measure is suggestive and not a confirmation.
Of course, this is all just one component of a workforce staffing analysis. Also included would be more precision around the relevant radius (in some places, workers are driving from very far away to get to work), the average and median hourly wage rate of the potential workforce, local unemployment, job vacancy, and labor turnover rates, and again probably many other factors. These are questions that the large employers spend a great amount of time and money trying to answer, and so they’re also naturally of great import to organized labor as well.
Operational significance
The other relevant question about these clusters concerns operational significance. If all of these large employers are gathering tightly in a particular area, there must be some reason why this is the case.
“Cargo airports” is the two-word explanation. DFW 1 and Phoenix are the only clusters that do not include or sit directly adjacent to a prominent cargo airport, and it’s no mistake that they have the loosest warehousing labor markets in the calculation above—their largest logistics corporations employ the smallest share of the regional low-wage labor market. All of the cargo airports in or next to the other eight clusters are in the top 25 cargo airports in terms of landed weight, except for KRIV in Riverside. Amazon shuttered its operations there earlier this year; this cluster may not qualify when we get new employment level numbers from OSHA next year.
Unsurprisingly, some facilities of outsize importance to the employers under analysis here are included in these clusters. Both FedEx’s international hub (Memphis) and its national hub (Indianapolis) are included; these two clusters employ 25,574 FedEx workers (about 7 percent of its entire American workforce). Walmart has a multi-site Import Distribution Center (#6060) in the Inland Empire 1 cluster that is the major repository for all imports coming in from LA and Long Beach. The two largest Home Depot distribution centers by workforce size are in the DFW 2 and Atlanta clusters, both of which cater to their sizable “Pro” customer market of contractors and builders.
One reason the Inland Empire 3 cluster might retain its place on this list, even with Amazon leaving KRIV, is that the company’s ONT8 Inbound Cross-Dock (adjacent to KRIV) appears, at least for the moment, to be its primary import processing center for its sortable network (items less than about 20 pounds). In Q2 of 2025, according to bill of lading data, ONT8 was the consignee for the largest volume of Amazon imports by twenty-foot equivalent units (TEU) and also by value ($519 million of goods, in one quarter). However, an initial analysis of 2025 Q3 data shows a steep dropoff in TEU volume at ONT8, indicating that Amazon may be consolidating its Inland Empire operations around San Bernardino and Ontario. It could be that ONT8 had been taking on a beefy load while Amazon’s National Inbound Cross-Dock network slowly came online. It could be that the dropoff represents a winding down of operations—unlikely, but always possible with Amazon. I’d need to know much more about what’s happening in Riverside and Moreno Valley to say for sure, but if Amazon were winding down ONT8, no amount of diligent worksite organizing could overcome it.
Zooming in and out
The above analysis is predicated on a delimitation of present convenience: I already had the data on the eleven private sector employers and USPS, thanks to the distribution network primers I have previously worked up. A more robust analysis would include as many of the big warehousing retailers as possible, including the dollar stores, Costco, Walgreens, and others, as well as the big third-party logistics warehousers, including GXO, Ryder, and NFI. There might be good reason to drop the facility limit (9) and just count absolute worker totals, in which case Louisville (UPS’s main air hub, around which UPS has 7,830 employees) and Cincinnati (Amazon’s main air hub, around which they have 8,631 employees) would make the list, and Atlanta would drop off. Perhaps the 400+ limit should be dropped, or maybe it should be retained and retail stores be included—in which case many Walmart Supercenters would make the cut. Anecdotally, a few Amazon Fulfillment Center workers who I’ve interviewed previously worked retail at Walmart.
To pursue any of these paths is to play with the variables and scales of analysis of the idea of logistical clustering. It’s in taking up multiple perspectives on what we know is an economically significant phenomenon that the concept’s true utility can be grasped. In other words, my point here is not so much to define a logistics cluster as to show how there are many useful definitions that can be employed to parse contemporary distribution networks in such a way as to make them more inductively metabolizable for analysts other than those working for the employers. It’s in fixing variables and seeing what comes into focus that we can pick out particular nodes and processes of importance to modern supply chains, and in turn the strategic nodes and implicit bargaining power within the contemporary logistical economy.
In the former manufacturing clusters of the Midwest and Northeast, leading corporations amassed immense power, which in turn produced the countervailing power of organized labor. These clusters were home to epoch-defining labor struggles of the twentieth century, which defined the parameters of the New Deal coalition and set the stage for the greatest period of working-class prosperity in American history. Today there is much less appreciation for the political and cultural significance of economic agglomerations in the logistics industry, but I’d guess that if organized labor gains even an approximation of the power it held in the 1950s, we’ll think of the Inland Empire in much the same way that unionists then thought of Akron and Flint.