$5.3 trillion of US federal government stimulus and relief spending have returned the economy to its pre-Covid growth trajectory. But that growth trajectory was hardly robust—either before or after the 2008 financial crisis. Nor was the slow decay of GDP growth rates unique to America. In the aggregate, the seven largest rich economies—the G7, composed of the US, Japan, Germany, France, Britain, Italy and Canada—saw growth in real per capita gross domestic product (GDP) slip by more than half from the 1980s to the 2010s.
Economists have called this slowdown “secular stagnation.” Secular stagnation is a seemingly permanent era of slower growth in productivity, investment, and output, and therefore also in per capita income. The Great Depression of the 1930s provoked the first debate about secular stagnation, which pitted John Maynard Keynes and Michał Kalecki against Joseph Schumpeter. The former saw idle workers and idle industrial capacity and called for aggressive fiscal policy and state-directed investment to restore growth. The latter saw idle capacity as evidence of over-investment and too high wages and called for liquidation of struggling firms and cuts in nominal wages.
Keynes and Kalecki saw income inequality as the source of stagnation. Rich people have a lower marginal propensity to consume, which reduces aggregate demand. Counter-intuitively, their efforts to save more do not stimulate more productive investment. Instead, firms confronted with weaker consumption demand shy away from new investment. They fear being saddled with even more excess and thus unprofitable capacity. Schumpeter, by contrast, located stagnation on the supply side. Great leaps in productivity and thus growth could only occur when entrepreneurs used promises of monopoly profits to mobilize enough credit to make revolutionary investments in new transportation systems, energy sources, and production processes. To do so, they needed to see monopoly profits.
These analyses are fundamentally macroeconomic, in that they assume that firms are relatively homogeneous. But what if firms differed in their strategies and the resulting industrial structures? This question was the terrain of Thorstein Veblen, who modified both Keynes and Schumpeter by showing how mesoeconomic factors—industrial structure—affected macro-economic outcomes. Veblen argued that firms sought monopoly not, contra Schumpeter, to make great leaps, but rather to shut down competition and make great and easy profits. What Veblen observed in the early 1900s was the beginning of the “Fordist” form of industrial organization: a two-tier economy composed of, on the one hand, highly profitable oligopolies or monopolies who could throttle output to raise prices, and, on the other, barely profitable firms with no such ability.
What explains the current slowdown, and does it differ from that of the 1930s? Consistent with Keynes and Kalecki, the financial sector usually gets the blame for lower aggregate demand because it is a great engine of income inequality and drains investment funds from non-financial firms. Less scrutinized are a small set of firms with monopolies created through their control over intellectual property rights (IPRs: patent, copyright, trademark, and brand). A Veblenian framework which accounts for changes in corporate strategy and structure—how firms plan to capture profit, and how they organize production and management to realize this goal—sheds light on how shifting the distribution of profits towards IPR-rich firms that have a low marginal propensity to invest hinders growth.
Strategic eras
I refer to the present moment, which is characterized by this shift, as the “Franchise” era. Its most distinctive features are the concentration of profits into IPR-rich firms with small labor headcounts, a low marginal propensity to invest, and relatively easy tax avoidance. These qualities have slowed growth in consumption, investment, and government spending—the three conventional measures of GDP for G7 countries. Higher-income employees of IPR-rich firms typically spend less out of each additional dollar of income, thereby slowing consumption growth. The monopoly firms that capture profit via IPRs don’t need to invest as much to expand production or maintain their market dominance; they can weaponize their IPRs to deter competitive entry with lawsuits. And IPR-rich firms can easily locate the legal ownership of their intellectual property (IP) in low- or no-tax countries, hindering the expansion of government spending.
This mode of profit making differs significantly from that of the Fordist era. From the end of World War II until the 1980s, firms acquired oligopoly profits using vertically integrated production structures that controlled asset-specific physical capital—that is, machinery that could not easily or profitably be redeployed to other uses. This specialized equipment was extraordinarily productive relative to more generic machinery, enabling huge economies of scale and thus potentially high profit volumes. High productivity and the cost of this machinery deterred potential competitors from entering the market. Incumbent firms could easily ramp up production and lower prices, leaving potential rivals saddled with expensive machines and limited profits. This asset-specific physical capital required uninterrupted production at near full capacity to be profitable. Firms with expensive equipment sitting idle would suffer dis-economies of scale.
The need for uninterrupted production had three important consequences. Firms expanded their employee headcount through vertical integration, bringing production of intermediate components in-house to assure a continuous and timely flow of required parts. In-house production of components, and even more so the need to run assembly lines continuously, gave those workers a credible threat to firms’ profitability: strikes interrupted production. After considerable conflict, firms agreed to share oligopoly profits with direct employees if workers ceded control over production to management. These big capital investments and big unionized workforces had positive macroeconomic consequences.
Fordist firms’ big labor headcounts combined with unionization to flatten the income distribution, boosting aggregate demand as workers consumed more each year. Their strategic use of large, fixed investments to create barriers to entry generated continuous investment. This had strong multiplier effects, again bolstering aggregate demand. Finally, firms’ desire for stable inputs and demand in largely national markets oriented their political behavior towards seeking macroeconomic stability and predictability.
Not all firms succeeded in creating an oligopoly or inserting themselves into the public or corporate planning routines charted by John Kenneth Galbraith. Fordist-era firms thus tended to polarize into two groups: larger, more profitable firms with stable markets, and smaller, less profitable firms in unstable or marginal markets. Mirroring this division was that between workers: largely male, white workers tended to have stable, higher wage employment in large firms, while largely minority, immigrant, and female workers were grouped into unstable, lower wage employment in smaller, less profitable firms.
The 1960s and 70s saw a wave of resistance to this model. The young and black workers replacing the older generation of white males in the big factories rejected mindless production routines and constant assembly line speed-up by engaging in wildcat strikes. Women rejected confinement to marginal labor markets and marriage. African-Americans and other minorities rejected exclusion from normal American civil and economic life. Firms responded to worker militancy by breaking up concentrated production and shedding legal responsibility for their workers. They de-merged, moved production offshore, contracted out, dispersed production geographically, and shed big physical capital footprints. Where possible, firms shifted risk onto someone else—creditors, workers, other firms—while retaining control over IPRs.
The new “Franchise” profit strategy sought monopoly profit via control over IPRs. It replaced the Fordist two-tier structure with a three-tier structure composed of (1) human-capital-intensive, low-headcount firms whose high profitability stems from robust IPRs; (2) physical-capital-intensive firms whose moderate profitability stems from investment barriers to entry or tacit production knowledge; and (3) labor-intensive, high-headcount firms producing undifferentiated services and commodities with low volumes of profit. Naturally, some firms blend characteristics of each tier. Intel, for example, blends IP ownership with a massive physical capital footprint in its semiconductor fabs; McDonalds blends brands with real estate ownership.
“Tech” is the obvious epicenter of the Franchise economy. But many firms outside of tech also pursued an IPR-based strategy. Restaurant or hotel chains are the most obvious “low tech” examples, with a high-profit brand owner franchising the use of its brand and production methods to smaller, lower-profit owner-operators in the bottom tier. For example, Hilton Worldwide owns roughly 5,900 registered trademarks and 16 carefully gradated and curated hotel brands, but owns barely 1 percent of the buildings carrying those brands.1 In both high- and low-tech industries, the general pattern is vertical disintegration and the segregation of IP ownership into a small number of legally distinct and highly profitable firms. This largely involves a rearrangement of legal boundaries, not production as such. This three-tier structure has made IPR-rich firms at the top astoundingly profitable—vide Apple. As a result, it skews the distribution of income upward, reducing demand and weakening the state’s fiscal base. This is because more profitable firms within the same industry tend to pay higher wages for the same job description. In other words, it’s not what you do but who you work for that determines your wages—inter-firm rather than intra-firm disparities largely drive wage inequality. As profits are concentrated into a smaller number of firms with low headcounts, more and more workers pile up in low profit, bottom-tier firms that deliver commodity services or perform simple manufacturing tasks. From 1961 to 1965, sixty-one of the biggest US employers were also among the top hundred firms by cumulative profit, accounting for 41.1 percent of total profits and 38 percent of total employment.2 From 2013 to 2017, only fifty-three of the biggest employers were also among the top one hundred firms by cumulative profit, accounting for 32.6 percent of total profits but only 27.6 percent of total employment.
Profits and investment
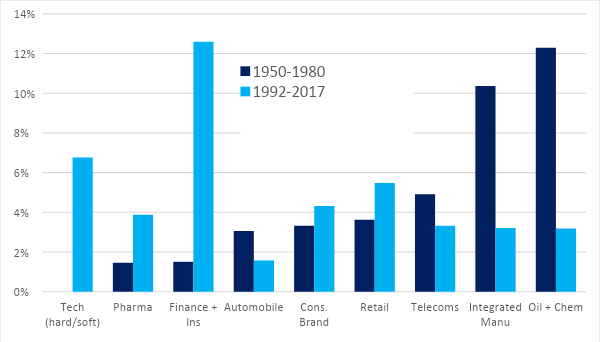
The Franchise structure also channels profits to firms with a low marginal propensity to invest, while starving firms with a high marginal propensity to invest. Though the top one hundred US listed firms by cumulative profit captured nearly 45 percent of profits in the period from 1950 to 1980, and almost the same 44 percent 1992 to 2017, the sectors in which these profits have accumulated have fundamentally altered.
Figure 1 below shows the shift in profits from the vertically integrated Fordist manufacturing and oil sectors toward the disintegrated Franchise IPR-based sectors, using the top 100 firms by cumulative profit. The top 100 firms are macroeconomically significant, as they account for 40.5 percent and 34 percent, respectively, of all capital expenditures in each era. Tech, bio-pharma, and finance sectors have replaced telecoms, oil related industries, and manufacturing as the sectors with the highest profit shares. In itself, this would not be problematic if these sectors invested at the same rate. But they don’t.

Source: Author calculation from WRDS Compustat
IRP-rich firms have less need and face less pressure to invest in new productive capacity. By definition monopoly means they face limited competition. While their “investment” does include things like massive server farms and sometimes even production equipment, most of their capital formation is simply paying salaries to people doing R&D. Neither brand management nor software development is particularly physical-capital intensive. Virtually no capital investment is needed to expand production; the marginal cost of an extra copy of Word, iOS or Thor: Ragnorak is essentially zero. Like high income households, high-profit and IPR-rich firms have a low marginal propensity to invest in new productive capacity.
Obviously, IPR-derived profits must flow somewhere (although the tech and bio-pharmaceutical firms hold enormous volumes of cash). But the top ten percent of US households typically save about half of every additional dollar they earn. Meanwhile, physical-capital-intensive firms that might do new productive investment with high Keynesian multipliers hesitate to borrow to fund investment. They quite rationally fear creating excess capacity in a context of slow growth. Most developed country markets in the 2000s were growing at about the rate of population growth, roughly 1 percent per year, and even formerly dynamic sectors like smartphones slowed markedly after 2016. The big manufacturing firms in the top hundred or two hundred firms can generate about 2 to 3 percent productivity growth each year simply through process engineering, so the incentive to invest in new capacity is low. Replace depreciated capital to retain market share? Yes. Create new—potentially excess—capacity? No.
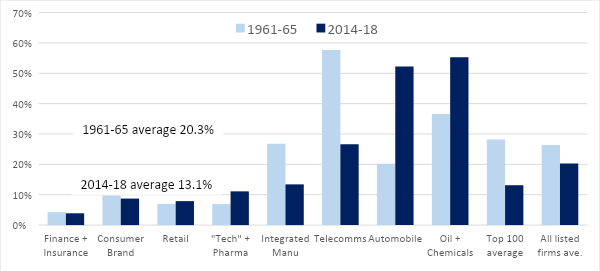
Below, Figure 2 compares capital expenditure as a percentage of profits (defined as gross operating income) in 1961-65 versus 2013-18 (‘peak’ Fordism and Franchise, respectively) for the top 100 firms by cumulative profit. Even in the context of a general decline in capital expenditure as a percent of gross profit, current high-profit sectors tend to transform much less of their gross profit into capital expenditure.

Source: Author construction from WRDS Compustat Data.
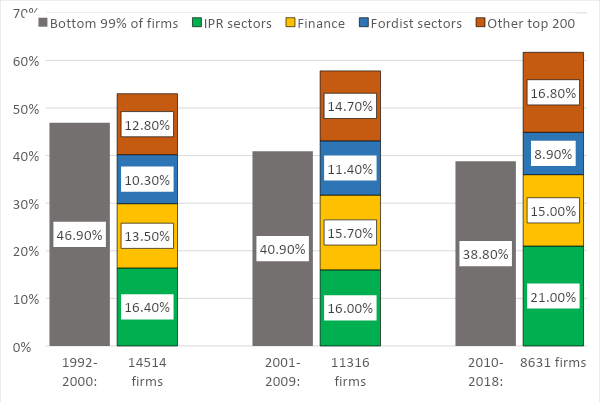
Focusing on the shift from Fordist to Franchise economy strategies and structures complements and in some ways supersedes the usual but narrower focus on financialization. Analyses of financialization correctly note the sharp rise in the financial sector’s profits after the 1980s. But if the problem is that the scale of those profits and their concentration into a handful of firms inhibits investment, then the IPR sectors must also matter. As Figure 3 shows, the IPR sectors captured more cumulative profit among listed US firms in each of the last three decades than the financial sectors, and that profit was similarly concentrated in a handful of firms. While the IPR sectors tend to make capital expenditures at a higher rate than the financial sectors, they are still well below average (Figure 2). Moreover, the financial sector profit share fell slightly in the past decade, while the IPR sectors’ share has grown.

Source: Author construction from WRDS Compustat data. (‘Fordist sectors’ = Mass production manufacturing and Oil.)
Finance and tech are also similar in their use of patents to defend profits and in their production processes.3 The financial sector exhibits the same three layer structure as other IPR sectors, with profits highly concentrated at the top. The Gini index (a measure of inequality where 0 is low and 1 is high) for financial sector cumulative profits is .95 for both gross and net income, 1992 to 2017. Those top firms capture the bulk of profits by selling bespoke derivatives and managing IPOs and investment funds. Small teams with high human capital and an ICT and software heavy production process generate those derivatives, much as in software and biotech. Second, generic, easily copied derivatives make little money. But subsequent to a 1998 federal court decision permitting patenting of mathematical and business algorithms, investment banks increasingly rely on Class 705 business process patents to protect new derivatives and processes. In 2014, for example, Bank of America filed roughly the same number of successful US patents as Novartis, Rolls Royce, or MIT, and JP Morgan as many as Genentech or Siemens.
Accurately conceptualizing the Franchise era opens up arenas for policy reforms distinct from those dealing with financialization. The core public policy problem is the pervasive use of state-created monopolies based on IPRs and state-tolerated monopolies elsewhere in the economy to concentrate profits into a handful of firms with low marginal propensity to invest in new productive capacity. A more robust antitrust policy, tighter regulation of derivatives, and an easier pathway to collective bargaining would go a long way towards rebalancing income away from highly concentrated profits and towards wages for the bulk of the population.
Hilton Worldwide Holdings Inc., 10-K Annual Report, Securities and Exchange Commission, 2018.
↩All data on profits, employee headcount, and capital expenditure are from WRDS Compustat unless otherwise noted. Compustat only has data on listed firms, but analyses by McKinsey suggest similar levels of concentration among privately held firms. Firms held by private equity typically tend to underinvest—the private equity model is built on stripping out profits—so including them would not change the conclusions presented here.
↩For another analysis, see Herman Mark Schwartz, “Corporate Profit Strategies and U.S. Economic Stagnation,” American Affairs, Winter 2021.
↩
Filed Under
