The 2008 financial crisis was an unprecedented demonstration of financialization in capitalism today. In the US, the collapse of real estate values revealed how formal credit channels—imagined as mechanisms of wealth creation—had brought unsustainable levels of household indebtedness down into new layers of American society. But if the experience showed how central household credit had become for low-income families to access housing in the US, it serves as just one example of how credit and debt shape not only business but household life globally. This is particularly evident in Brazil, where the cost of debts and debt service make up a growing share of annual household income.
Adjusting household income to include the burden of debt service shows that debt in Brazil is pulling an increasing share of the population below the poverty line. The temporal analysis below shows this clearly in two distinct movements. Between 2009 and 2018, the expansion of social-insurance programs coincided with a dramatic decline in poverty over all. At the same time, debt has grown persistently. Family budgets’ debt-service commitments have led to an increase in Brazil in what the economists Steven Pressman and Robert H. Scott refer to as the “debt poor”—those families whose total or disposable income does not qualify them as poor, given whatever income threshold, but whose disposable income net of debt service falls below that threshold.1
The Brazilian case thus exemplifies the social effects of financialization: by eliminating a barrier to the expansion of credit to low-income people—the lack of collateral—the increasing coverage of cash transfer benefits has coincided with new financial services and products aimed at socially vulnerable layers of the population. Observing the effect of this growth of household debt on living conditions requires adapting our economic and social measurements. But doing so allows us to see how the nature of poverty is changing, as debt—rather than lack of income alone—becomes an important vector for its incidence.
Credit as a structural component of the Brazilian economy
The importance of debt in contemporary capitalism is not only a result of its quantitative growth; debt reflects a a series of transformations brought about by financialization. Favorable macroeconomic conditions and financial innovations in the early 2000s drove lenders to extend credit downward to middle- and low-income layers of the population, a trend celebrated domestically as “financial democratization” following the political democratization of the 1980s and 1990s, and echoed in the US today among claims of “democratizing finance” by retail securities brokers.
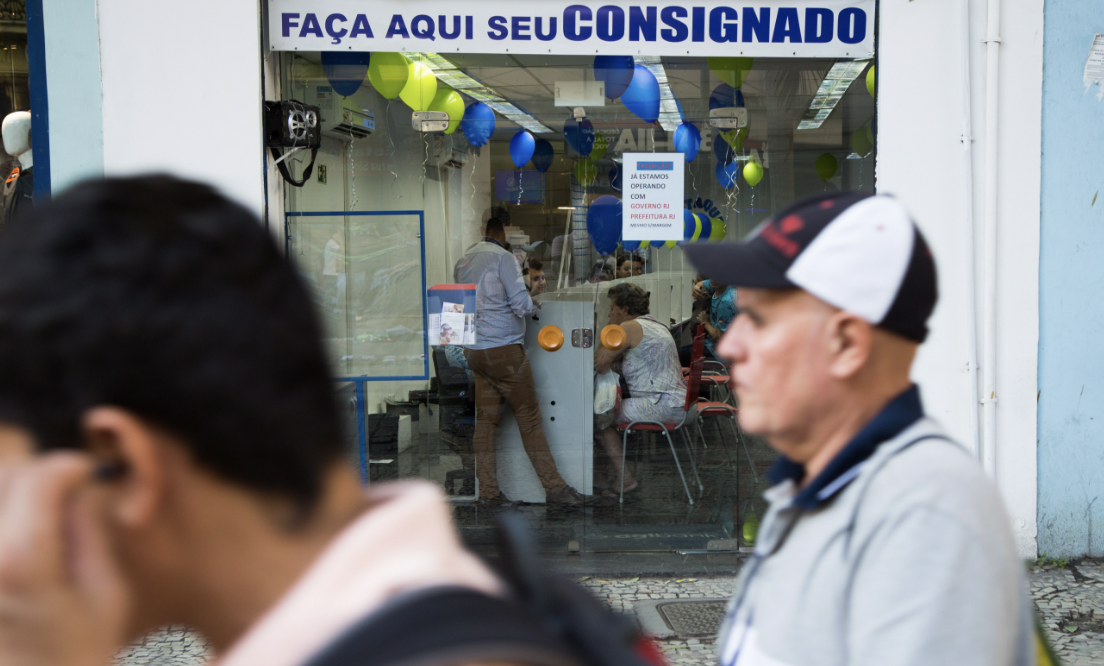
Lenders’ most prominent innovation in this period was the payroll loan—a form of consignment credit in which interest and principal installments are deducted directly from the paycheck. Reducing risks of late payments and default, the payroll loan allowed much lower interest rates. According to data available from the Central Bank of Brazil, the main clientele for this type of credit is public servants, retirees and pensioners in the public social-security system—all those whose monthly income is the responsibility of the public sector. The state becomes the guarantor of debt, especially for retirees and pensioners, a process Lena Lavinas has described as “the collateralization of social policy.”
This process relates to yet another transformation: the expansion of debt into new socioeconomic spheres, including those in which debt previously had only marginal involvement. Debt is now a determining factor in access to goods and services, entering spheres previously delegated to social policy and de-mercantilized forms of social provision. The design of social policy has begun to promote debt, to the extent that payment is now necessary for social reproduction.
Through financial innovations such as securities and synthetic bonds—which transform regular payment flows into financial assets traded on secondary market—household debt has also been integrated into global financial markets. These debts then become the target of financial speculation and a source of profit.2
Graph 1: Indebtedness (% of income accumulated over 12 months) and Commitment of income to service debts (% of quarterly moving average of income)3
GRAPH TK
The expansion of household debt in Brazil (Graph 1) began at a time of growth in Gross Domestic Product (GDP), employment and income—and, consequently, a fall in poverty. Credit was instrumental in maintaining this growth, higher during the period between 2003 and 2014 than in previous decades. On the demand side, the main factor in GDP expansion was consumption rather than investment. The increase in consumption was due to the rise in income, but also to credit.4 According to one study, “free credit” for individuals (as opposed to “directed credit” subject to laws and regulations) accounted for 45 percent of the growth in consumption and one third of the growth in GDP between 2004 and 2013.5
From 2014 onwards, however, the situation reversed. In 2015–2016, the business cycle turned and Brazil fell into recession. Indebtedness fell momentarily during the slow and virtually stagnant recovery. But in the recovery of 2017–2018 credit growth resumed, even as income growth, employment, and poverty reduction all performed poorly. The growth of credit in this extremely unfavorable economic context indicates its structural role in the Brazilian economy; its obligations persist well after its contributions to GDP.
“Debt poverty” in Brazil
The use of income measurements alone do not take into account this structural role of household debt in the standard of living across the population. As debt rises, an increasingly significant portion of disposable income is not actually disposable. If income must be spent on servicing past debts, it is not available for spending that contributes to current household well being. To capture more accurately what portion of households fall above or below a given consumption threshold—the standard method of defining poverty—Pressman and Scott advocate an alternative definition of income for poverty indices: “uncommitted disposable income.” This measure is defined as disposable income (i.e. net of taxes) minus debt-servicing costs.6
Since the establishment of a poverty line is related to a socially acceptable minimum standard of living, uncommitted disposable income is a more comprehensive and accurate measure of whether households are able to afford that standard. By deducting debt-service from income, we can see how debt contributes to the incidence of poverty over all. It also makes visible a specific social group: those whose disposable income is above the poverty line but who fall below it when debt-service is deducted. This group is known as the “debt poor.”
The Pesquisa de Orçamentos Familiares (POF or Family Budget Survey), carried out by the Instituto Brasileiro de Geografia e Estatística (IBGE or Brazilian Institute of Geography and Statistics) allows one to construct statistical series of disposable income and uncommitted disposable income for families in Brazil. Using this series, one can measure the share of the population (in this case, families) that falls below any given income threshold. Using the two income thresholds for existing poverty definitions—the Bolsa Família eligibility line, approximately R$ 200.00; and the World Bank’s international poverty line of around R$ 596.00—a comparison of these two series between 2008–2009 and 2017–2018 shows a picture of both the reduction of poverty in Brazil and the effect of indebtedness in pulling people into poverty.7
Graph 2: Monetary poverty rate based on disposable income and uncommitted disposable income
GRAPH TK
First, note that the change in the definition of income does not alter the downward trend in either poverty threshold over the period considered. Debt, despite increasing, was not able to reverse the overall trend of poverty alleviation in Brazil. Graph 2 shows the evolution of the poverty rate in the two income series (disposable and uncommitted disposable) for the two different thresholds considered.
However, there is a clear increase in the impact of indebtedness on poverty. As Figure 3 below shows, between 2008–2009 and 2017–2018 the number of debt poor—those whose disposable income places them above the poverty line but whose uncommitted disposable income pulls them below it—increased as a share of the impoverished population for either poverty threshold. In other words, the number of people whose debt-service commitments brought them below either poverty threshold increased. In absolute terms, there are 475,000 more debt poor people at the R$200.00 poverty line and 1.5 million more debt poor people at the R$596.00 poverty line.8
Graph 3: Difference between poverty rates based on disposable income and uncommitted disposable income
GRAPH TK
Adjusting our poverty metrics to account for the debt poor allows us to estimate the additional monetary resources that would be needed to eradicate poverty, all else equal, beyond the monetary transfers already in place—notably Bolsa Família, social security and welfare benefits, unemployment insurance, etc.. This measure includes both the debt poor and those who would already be in poverty even without debt, but whose income is reduced by debt service payments. As can be seen in Graph 4, the transfers necessary to raise debt-poor incomes above the poverty threshold increases with the passage of time and the growth of this population. Looking initially at the poverty line of R$200.00 in 2008-2009, the inclusion of debt represents an additional need of R$10.5 billion; in 2017-2018, R$18.2 billion (73 percent more). For the R$596.00 poverty line, the figures were: R$67.7 billion in 2008-2009 and R$115.6 billion in 2017-2018 (71 percent more).
Graph 4: Difference between the amount of additional monetary resources to eradicate poverty when debt is taken into account (in R$ million 2021)
GRAPH TK
In summary, the evolution of poverty in Brazil between 2009 and 2018 includes two distinct movements: a fall in poverty, but a rise in the effects of indebtedness on poverty, reflected by an increase in the number of debt poor and the share of those in poverty due to debt. Although Brazil has reduced poverty, conventional measures fail to capture actual incomes as debt obligations increase. Both the size and intensity of real poverty should be increased accordingly by using uncommitted income rather than disposable income.
But beyond identifying this neglected layer of the population, an analysis of the effects of indebtedness on poverty also shows macroeconomic correlations. If the share of the debt poor has risen overtime, then further increases in indebtedness may further increase poverty.
The fact that a significant population entered poverty as a result of their debts demonstrates that credit to meet needs is not a silver bullet. This becomes even more pressing when this credit is accompanied by austerity in the public sector, which forces households to approach the market for their means of social reproduction, such as health, education and housing. Neglecting the direct effects of indebtedness on income obscures a key dynamic of financialization in Brazil: when the coverage and value of monetary benefits and the public and universal supply of goods and services are inadequate, loans become the last lifeline.
Pressman, Steven, and Robert H. Scott. 2009. “Who Are the Debt Poor?” Journal of Economic Issues 43 (2): 423–32. https://www.jstor.org/stable/25511445.
↩Mader, Philip. 2015. The Political Economy of Microfinance. London: Palgrave Macmillan UK. https://doi.org/10.1057/9781137364210.
↩As can be seen, the growth in indebtedness did not lead to a corresponding rise in the commitment of income. One possible explanation for this coexistence lies in the change in the composition of debt. Over the course of the historical series, there has been a detachment between housing and non-housing debt, with the former rising from an average of 13.7 percent between 2005 and 2008 to just under 40 percent of accumulated income. The same process does not occur in terms of income commitment, which continues to be predominantly determined by the non-housing portion. As housing loans typically have longer terms, this type of credit has less of an effect on families’ recurring financial capacity – here materialized in the concept of income commitment.
↩Lavinas, Lena. 2017. The Takeover of Social Policy by Financialization : The Brazilian Paradox. New York, NY: Palgrave Macmillan.
↩Borça Jr., Gilberto, and Danilo Guimarães. 2015. “Impacto do ciclo expansionista de crédito à pessoa física no desempenho da economia brasileira 2004-2013”. Revista do BNDES 43: 119-159
↩Pressman and Scott (2007, 2009a, 2009b). Because these are associated with data disclosure, the authors only use legal deductions. However, we affirm that it must be de facto deduced from the service, or as it was carried out in this analysis: “we hold that this debt makes income inequality worse because any debt incurred to meet immediate needs leads to large interest payments in the future as well as the necessity of repaying the principal that was borrowed. It is these inequalities, and not the inequalities in disposable income, that are likely to generate economic and social problems.” (Pressman and Scott 2009a, pp. 142)
↩US$ 6.85 per day in PPP 2017, adjusted for inflation. Both values are in 2021 values.
↩0.19 percent of the population and 0.68 percent of the population.
↩
Filed Under